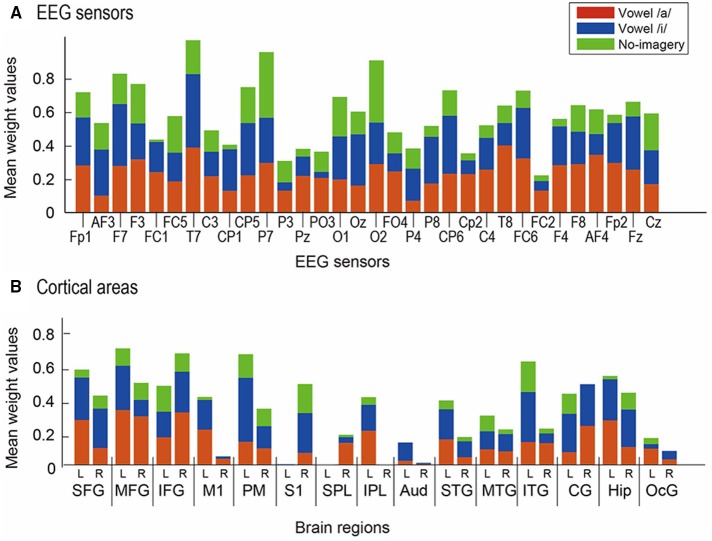
Figure 7.
Mean normalized weight values across participants. Red bars represent results from weight for vowel /a/, blue bars for vowel /i/, and green bars for no-imagery. (A) Values for 32 EEG sensors were compared. (B) Values for 30 ROIs were compared: left (L) and right (R) hemisphere of SFG, MFG, IFG, M1, PM, S1, SPL, IPL, Aud, STG, MTG, ITG, CG, Hip, and OcG.

