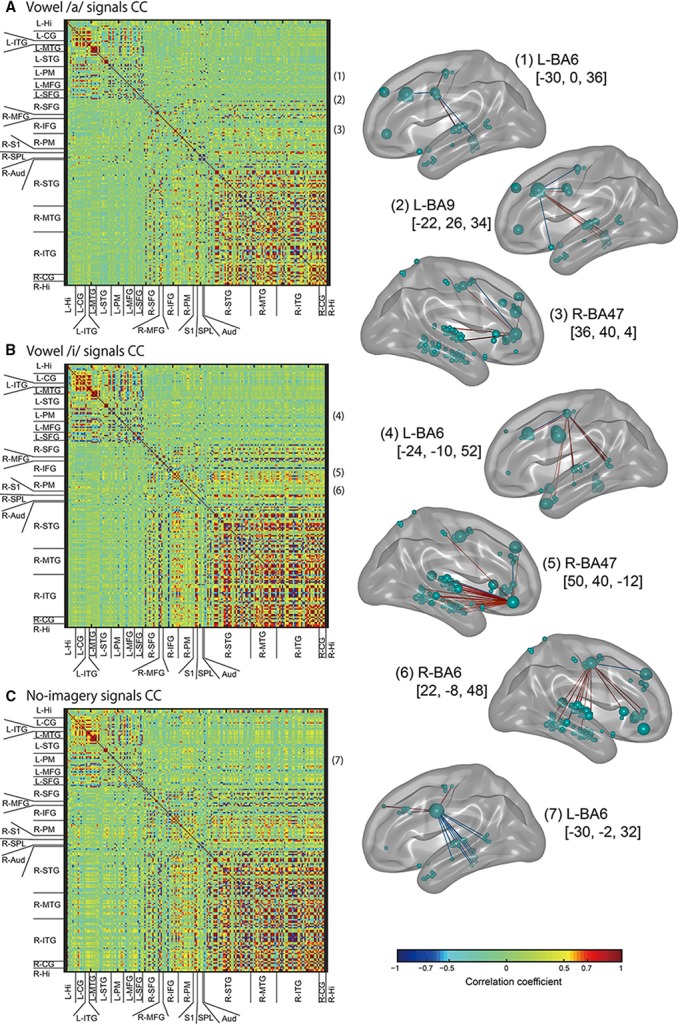
Figure 9.

Left panel: Color maps of correlation coefficient (CC) values for EEG cortical current signals. ROIs names that cortical vertices were included in are listed along with the horizontal and vertical axes. CC values were calculated for all tasks signals: vowel /a/ (A), vowel /i/ (B), and no-imagery (C). Right panel: The FSHV-vertices defined in Figure 6 [(1–7) in this figure) were set as seeds, and positive correlations above 0.6 (red lines) and negative correlations below–0.6 (blue lines) were visualized with BrainNet Viewer (Xia et al., 2013) (http://www.nitrc.org/projects/bnv/). Green balls on the brain maps denote vertices, with their sizes representing mean weight values, and names of the brain areas in Brodmann style and MNI coordinates of the seeds are written besides the brain maps.
