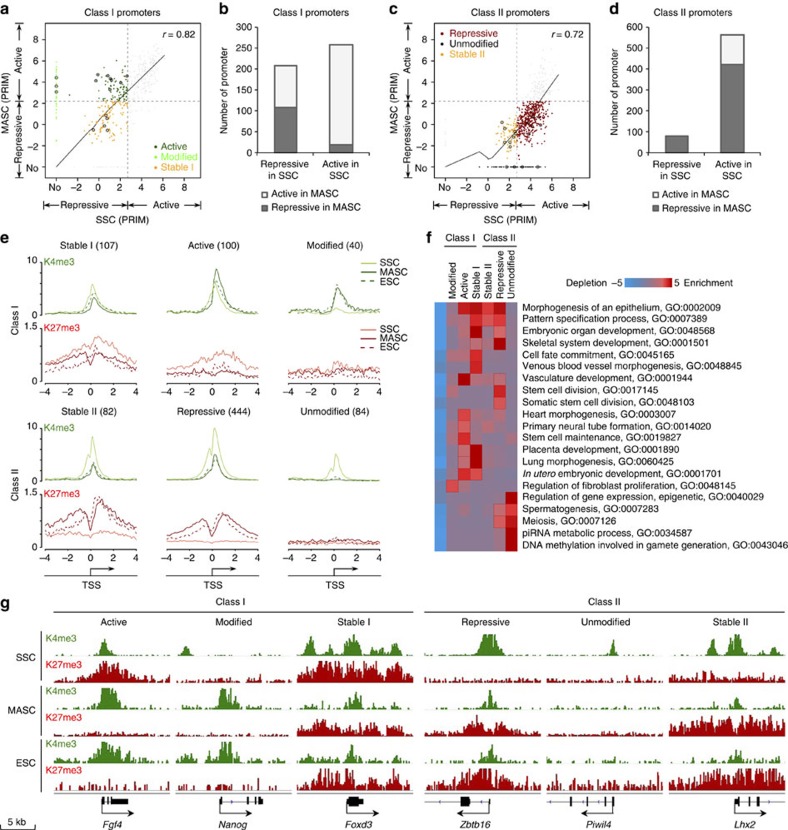
Figure 4. Promoter chromatin states of differentially expressed genes are selectively changed.
(a) Comparison of chromatin states (PRIMs) between SSCs and MASCs for all class I gene promoters (grey dots). x axis, PRIMs from SSCs; y axis, PRIMs from MASCs. Black circles, representative class I genes from Fig. 3a; dashed black line, cutoff between active and repressive chromatin states; dark grey line, optimal curve fits to all class I gene promoters. r, correlation coefficient with all class I gene promoter PRIMs. On the basis of the cutoff value, three groups of promoters were selected: MASCActive (dark green dots); MASCModified (light green dots); and MASCStable I (yellow dots). (b) Number of class I gene promoters changing between repressive and active chromatin states in SSCs and MASCs. Light grey, epigenetically active promoters in MASCs; dark grey, epigenetically repressive promoters in MASCs. (c) Comparison of chromatin states (PRIMs) between SSCs and MASCs for all class II gene promoters (grey dots). Black circles, representative class II from Fig. 3a; dark grey line, optimal curve fits to all class II gene promoters. r, correlation coefficient with all class II gene promoter PRIMs. On the basis of the cutoff value, three groups of promoters were selected: MASCRepressive (dark red dots); MASCUnmodified (black dots); and MASCStable II (yellow dots). (d) Number of class II gene promoters changing between repressive and active chromatin states in SSCs and MASCs. Light grey, epigenetically active promoters in MASCs; dark grey, epigenetically repressive promoters in MASCs. (e) Histone modification enrichment profiling for selected class I gene promoters (top) and class II gene promoters (bottom) (grouped as in a,c). Number in brackets, gene number in each group. Green, K4me3; red, K27me3; solid light line, SSCs; solid dark line, MASCs; dashed dark line, ESCs; arrow, direction of transcription; x axis, distance to TSS; y axis, average read density. TSS, transcription start site. (f) GO enrichment in selected genes. Genes are grouped by promoter PRIMs as in a and c. (g) Promoter modification at selected genes. Top, expression class and promoter type of each gene; green, K4me3; red, K27me3. K4me3 track range, 0–1; K27me3 track range, 0–0.5.

