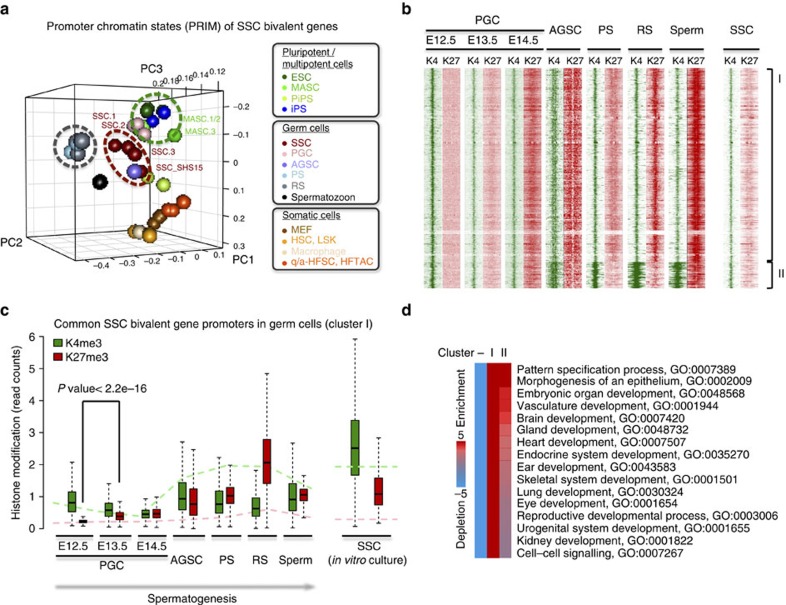
Figure 6. SSCs maintain consistent promoter bivalency with germ cells in vivo.
(a) Three-dimensional (3D) PCA plot based on PRIMs of all promoters with K4me3+K27me3 bivalent histone modifications in SSCs. Different cell types are distinguished by colours as in Fig. 1. (b) k-means clustering of SSC bivalent genes by similarity of K4me3 and K27me3 profiles at promoters. Green, K4me3; red, K27me3. Cluster I, 2,644 genes; cluster II, 372 genes. (c) Histone modification profiling at promoters of all cluster I genes as grouped in b. Germ cells include those isolated from testis by fluorescent-activated cell sorting (left) and SSCs cultured in vitro (right). y axis, average read count within promoter region. Green box, K4me3 modification; red box, K27me3 modification. The bottom and top of the boxes indicate the 25th and 75th percentiles, the central bars indicate medians and whiskers indicate non-outlier extremes. P values were calculated using Wilcoxon tests. Dashed green line, average read count of K4me3 modification at all promoters in each cell type; dashed red line, average read count of K27me3 modification at all promoters in each cell type. (d) GO enrichment using iPAGE. Genes are grouped by promoter K4me3 and K27me3 profiles as in b.

