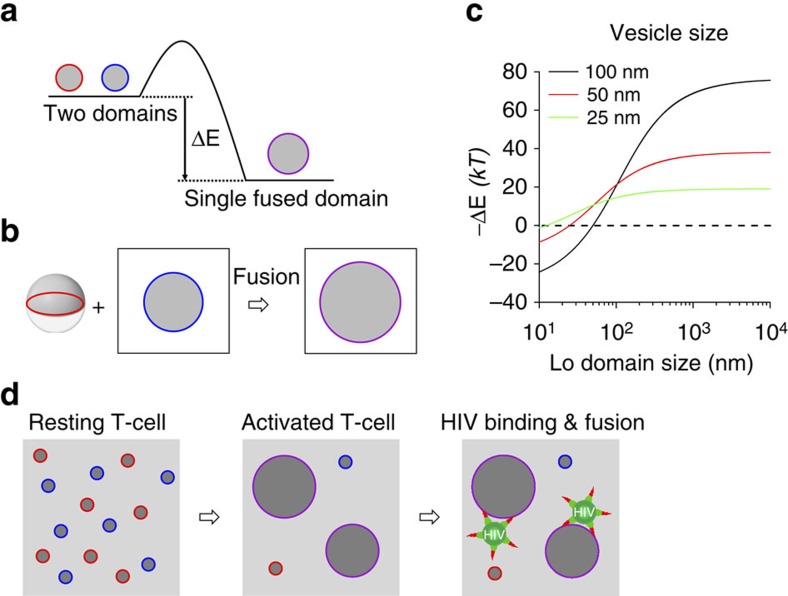
Figure 7. Release of boundary energy by domain coalescence.
(a) Schematic diagram illustrating the change of boundary energy by domain coalescence. (b) A symmetric vesicle with two equally sized Lo- and Ld-phase hemispheres fuses with a Lo domain in a planar membrane. (c) Change of boundary energy for the reaction shown in b as a function of Lo domain size in the planar membrane for vesicles of different sizes. Domain fluctuations are not considered in this simple geometrical model (see text). (d) Schematic diagram illustrating biological implications of domain coalescence in T-cell activation on HIV binding and fusion at domain boundaries. The small domains shown in resting T-cells may actually be dynamic fluctuating clusters or nanodomains of receptors and lipids29, but even then, the concept of lateral assembly of multiple clusters and domain growth during T-cell activation is still valid.

