Figure 3.

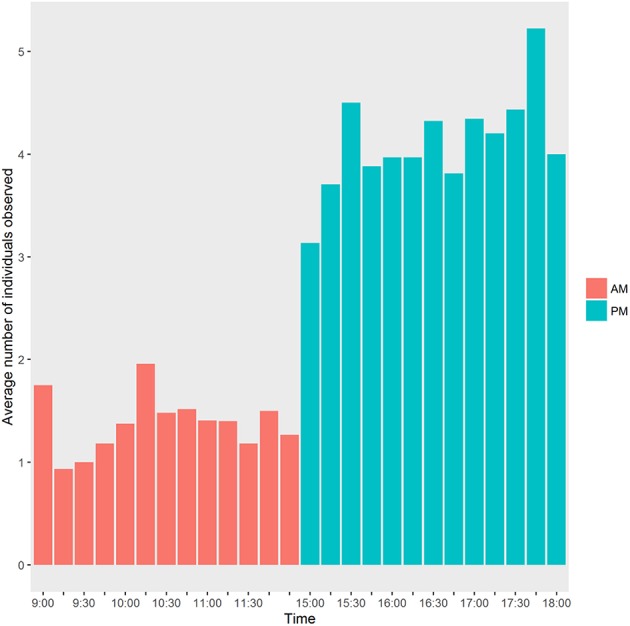
Histogram of the average number of individuals observed during each period. 12:00 is considered in the morning period (am) in this figure. The bar plot was realized with the ggplot2 package (Wickham, 2009).

Histogram of the average number of individuals observed during each period. 12:00 is considered in the morning period (am) in this figure. The bar plot was realized with the ggplot2 package (Wickham, 2009).