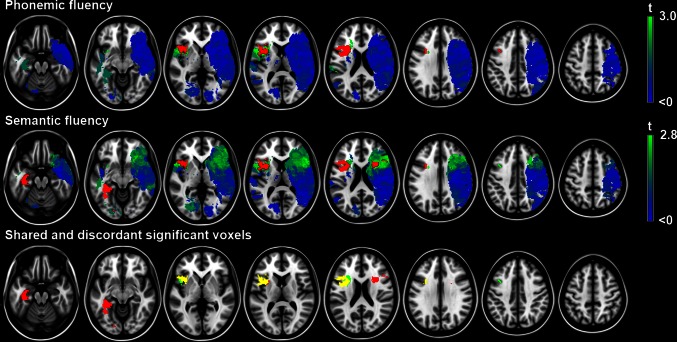
Fig. 2.
Voxel-based lesion-symptom mapping results. Map of the voxel-wise association (t statistic) between the presence of a lesion and cognitive performance. Voxels exceeding the false discovery rate threshold (q = 0.05) are rendered in red. Non-significant voxels are rendered on a scale from blue (t < 0) to bright green (t value just below threshold). Negative t values (meaning the presence of a lesion was correlated with better cognitive performance) were not statistically significant. Lower row voxels with a statistically significant inverse association with performance on either semantic fluency (red), phonemic fluency (green) or both (yellow) are depicted. Note that the anatomical correlates overlap in left frontal regions, but are discordant in left temporal and right frontal regions. Semantic and phonemic fluency were corrected for age, sex and level of education using linear regression. The results are projected on the MNI 1-mm template (Z coordinates: −20, −10, 0, 10, 20, 30, 40, 50). The right hemisphere is depicted on the right

