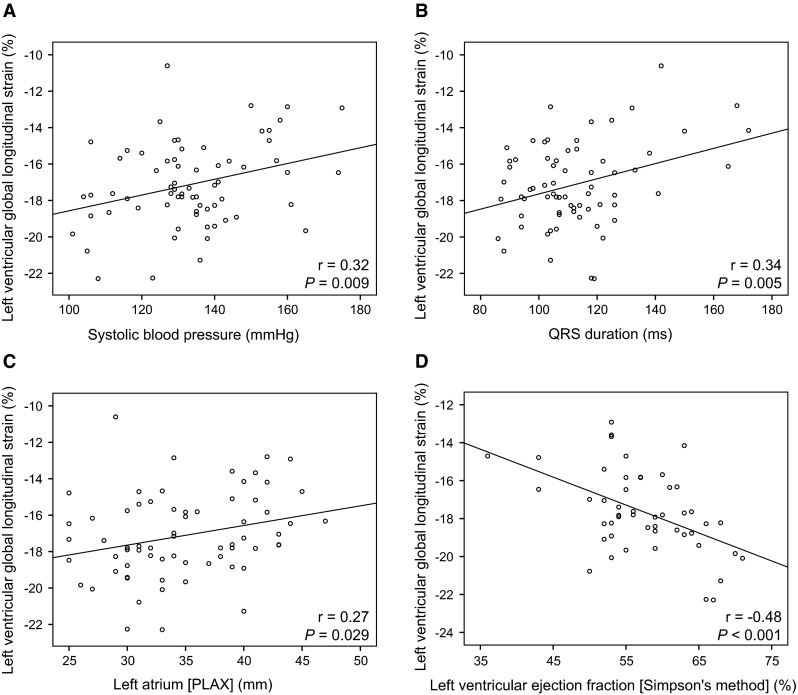
Fig. 4.

Scatter plots showing correlations with left ventricular global longitudinal strain. Significant correlations were observed between LV GLS and systolic blood pressure (a), QRS-duration (b), left atrial dimension at parasternal long axis view (c), and left ventricular ejection fraction measured with Simpson’s biplane method (d)
