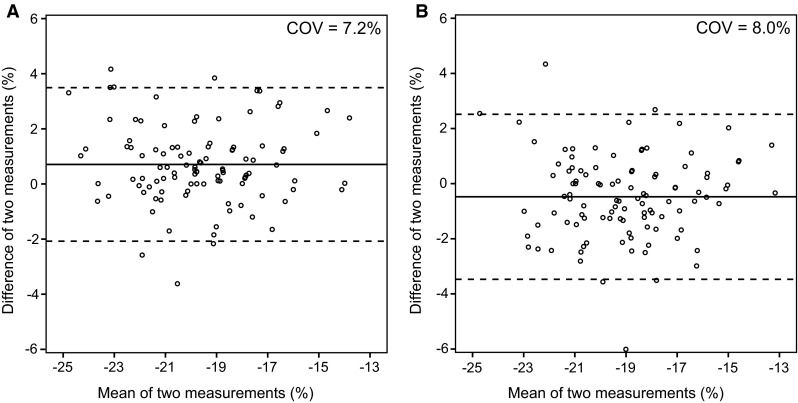
Fig. 6.

Bland–Altman plots demonstrating intra-observer and inter-observer agreement. Left ventricular global longitudinal strain measurements on apical four-chamber view for intra-observer (a) and inter-observer agreement (b). The solid lines depict the mean difference of two measurements, and the dashed lines depict the limits of agreement. COV coefficient of variation
