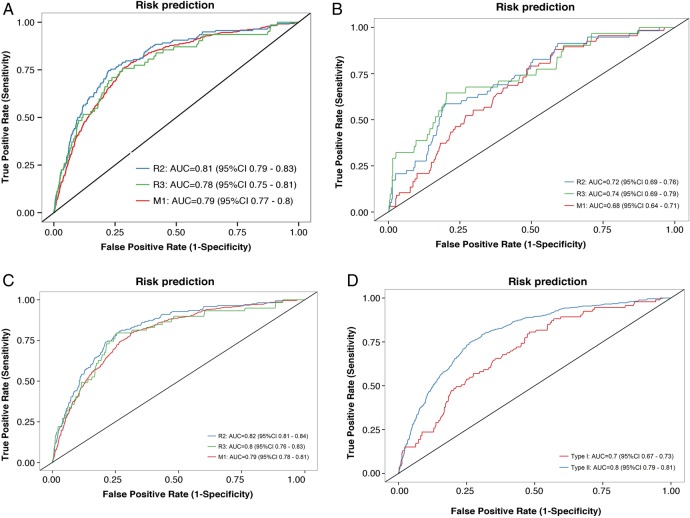
Figure 1.
(A) ROC (receiver operating characteristic) curves for predicting R2 (preproliferative retinopathy), R3A (active proliferative retinopathy) or M1 (diabetic maculopathy), based on the risk estimates of the algorithm. Patients with type I and type II diabetes together. Curves for R2 are coloured in blue, R3A in green and M1 in red. The AUC (area under curve) was: R2: 0.81 (CI 0.79 to 0.83), R3A: 0.78 (CI 0.75 to 0.81), M1: 0.79 (CI 0.77 to 0.80). (B) ROC curves for predicting R2, R3A or M1, based on the risk estimates of the algorithm. Patients with type I diabetes only. Curves for R2 are coloured in blue, R3A in green and M1 in red. The AUC was: R2: 0.72 (CI 0.69 to 0.76), R3A: 0.74 (CI 0.69 to 0.79), M1: 0.68 (CI 0.64 to 0.71). (C) ROC curves for risk predicting of R2, R3A or M1 based on the risk estimates of the algorithm. Patients with type II diabetes only. Curves for R2 are coloured in blue, R3A in green and M1 in red. The AUC was: R2: 0.83 (CI 0.81 to 0.84), R3A: 0.80 (CI 0.76 to 0.83), M1: 0.79 (CI 0.78 to 0.81). (D) ROC curves for predicting any of R2, R3A or M1 based on the risk estimates of the algorithm. Coloured in blue are patients with type II diabetes, and patients with type I diabetes are shown in red. The AUC is 70% for patients with type I diabetes (CI 0.67 to 0.73) and 80% for patients with type II diabetes (CI 0.78 to 0.81).

