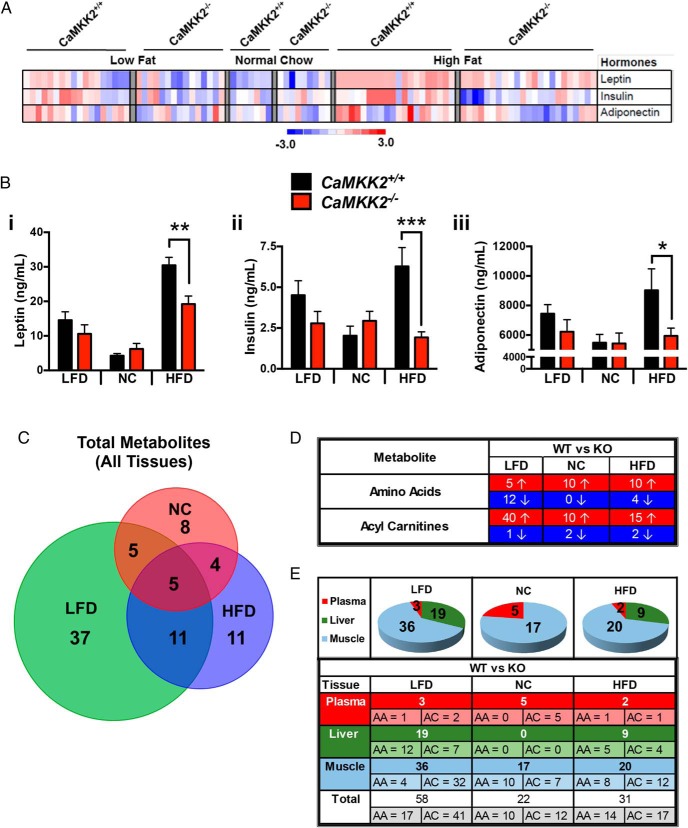
Figure 3.
Summary of metabolic changes upon ablation of CaMKK2. A, Heat map representation of levels of selected circulating hormones (leptin, insulin, and adiponectin) from CaMKK2+/+ and CaMKK2−/− male mice fed NC, LFD, or HFD. B, Graphical representation of raw data from A representing the average of leptin (i), insulin (ii), and adiponectin (iii) from CaMKK2+/+ and CaMKK2−/− male mice fed NC, LFD, or HFD. Data are graphed as mean ± SEM. C, Venn diagram comparison of total metabolites (AAs and ACs) analyzed via MS-based metabolomics from plasma, liver, and muscle from CaMKK2+/+ and CaMKK2−/− mice fed NC, LFD, or HFD. The number of individual metabolites whose values were statistically different between CaMKK2+/+ and CaMKK2−/− mice fed a specific diet is indicated within each colored circle representing the diet tested, NC (red), LFD (green), and HFD (blue), with overlapping metabolites indicated in the intersecting regions of the Venn diagram. D, Tabular representation of the number of individual metabolites whose values were statistically different between CaMKK2+/+ and CaMKK2−/− mice fed each diet (NC, LFD, and HFD) and the direction of change (increase or decrease) relative to wild-type mice. E, Summary of MS-based metabolomics analysis of CaMKK2+/+ and CaMKK2−/− mice fed different diets (NC, LFD, and HFD). The number of individual metabolites (AA, AC) whose values were statistically different between CaMKK2+/+ and CaMKK2−/− mice fed each specific diet (NC, LFD, and HFD) are provided for the 3 tissues analyzed (plasma, liver, and muscle). Data are represented as mean ± SEM. *, P ≤ .05; **, P ≤ .01; ***, P ≤ .001.

