Figure 5.
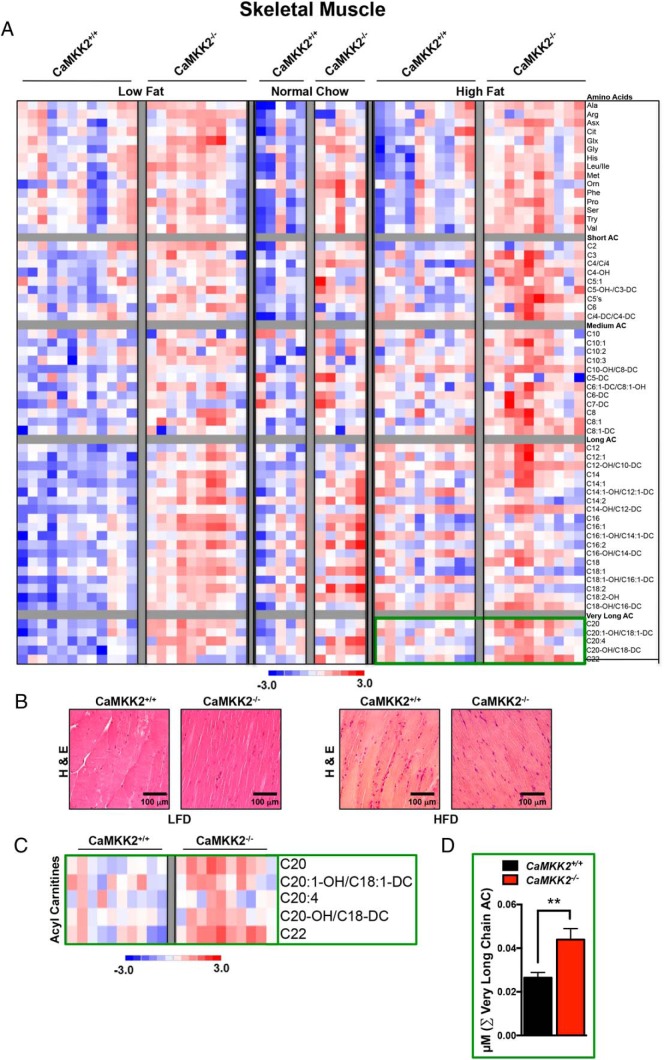
Metabolomic analysis upon CaMKK2 ablation shows alterations in global skeletal muscle metabolism. A, Heat map representation of z-score transformed raw data from skeletal muscle-specific MS-based metabolomics analysis of AAs and ACs from CaMKK2+/+ and CaMKK2−/− mice fed NC, LFD, or HFD. B, H&E-stained skeletal muscle sections from CaMKK2+/+ and CaMKK2−/− mice fed LFD and HFD. Scale bars, 100 μm. C, Enlarged heat map representation of selected z-score transformed raw data from metabolomics analysis of very long chain ACs from skeletal muscle of CaMKK2+/+ and CaMKK2−/− mice fed HFD. C, Graphical representation of data from C representing the average of the sum (Σ) of very long chain AC levels from CaMKK2+/+ and CaMKK2−/− mice fed HFD. Data are graphed as mean ± SEM. **, P ≤ .01.

