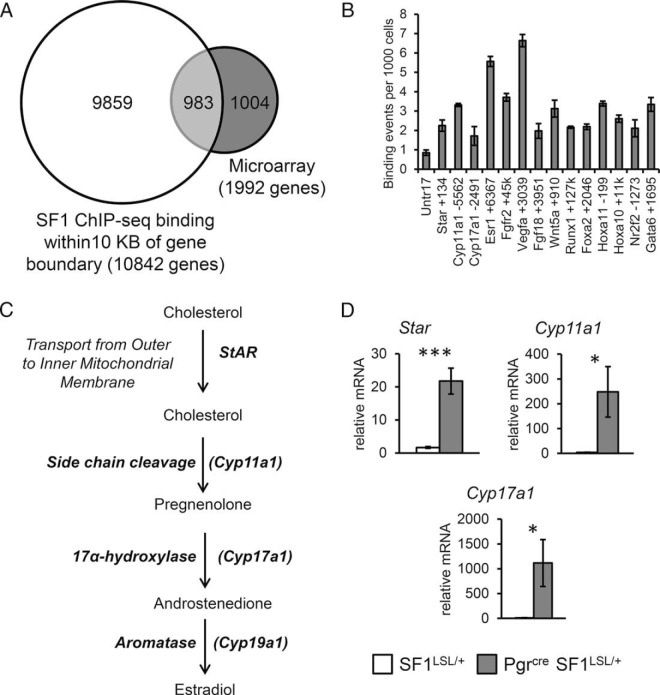
Figure 6.
Validation of direct SF1 targets. A, Venn diagram comparison of genes bound by SF1 within 10 kb of gene boundaries and genes with differential expression by microarray in uteri of 8- to 10-week-old ovariectomized females. B, ChIP-qPCR validation of direct targets in independent uterine samples from 8- to 10-week-old ovariectomized females. C, Schematic for genes encoding enzymes for synthesis of E2 from the cholesterol precursor. D, RT-qPCR validation of expression of steroidogenic genes in independent uterine samples from 8- to 10-week-old ovariectomized females. Two tailed t test significance indicated by *, P < .05 and ***, P < .001. SF1LSL/+ n = 8 and Pgrcre/+ SF1LSL/+ n = 6.

