Figure 3.
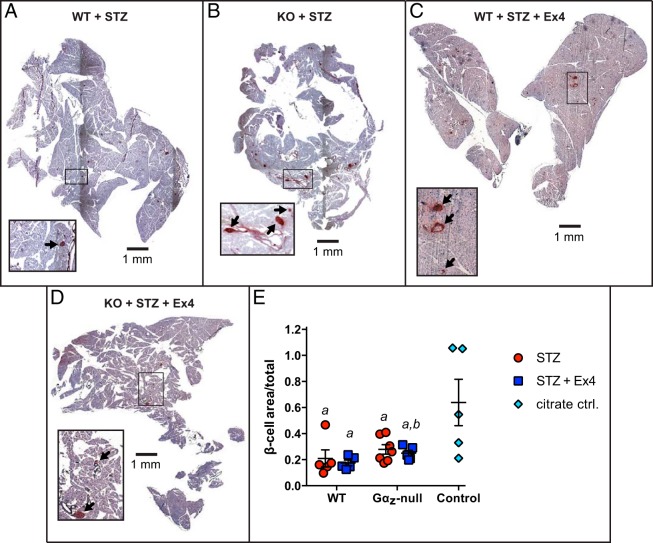
Gαz-null mice treated with Ex4 have increased β-cell fractional area. A–D, Representative pancreas sections from each experimental group subjected to immunohistochemical analysis for insulin (brown) and counterstained with hematoxylin (purple). In all 4 images, the scale bar indicates 1 mm. A 4-fold enlarged section is shown in an inset in each image, with black arrows indicating the insulin-positive area that was quantified. E, Quantification of β-cell fractional area calculated from all islets counted on 3 sections of each mouse pancreas separated by at least 200 μm. Data are shown as the mean ± SEM; n = 5–7 mice per group. Data were compared by one-way ANOVA with Dunnet's multiple comparisons test post hoc. a, P < .05 vs control; b, P < .05 vs control and P < .05 vs WT STZ + Ex4.

