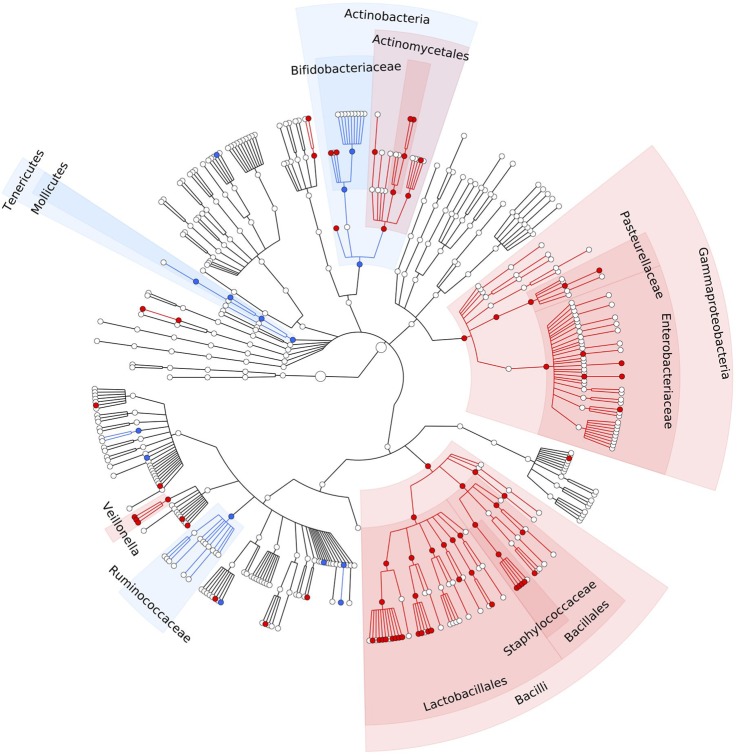
Figure 1.
PPI-associated statistically significant differences in the gut microbiome. Meta-analysis of three independent cohorts comprising 1815 faecal samples, showing a cladogram (circular hierarchical tree) of 92 significantly increased or decreased bacterial taxa in the gut microbiome of PPI users compared with non-users (FDR<0.05). Each dot represents a bacterial taxon. The two innermost dots represent the highest level of taxonomy in our data: the kingdoms Archea and Bacteria (prokaryotes), followed outwards by the lower levels: phylum, class, order, family, genus and species. Red dots represent significantly increased taxa. Blue dots represent significantly decreased taxa. FDR, false discovery rate; PPI, proton pump inhibitor.

