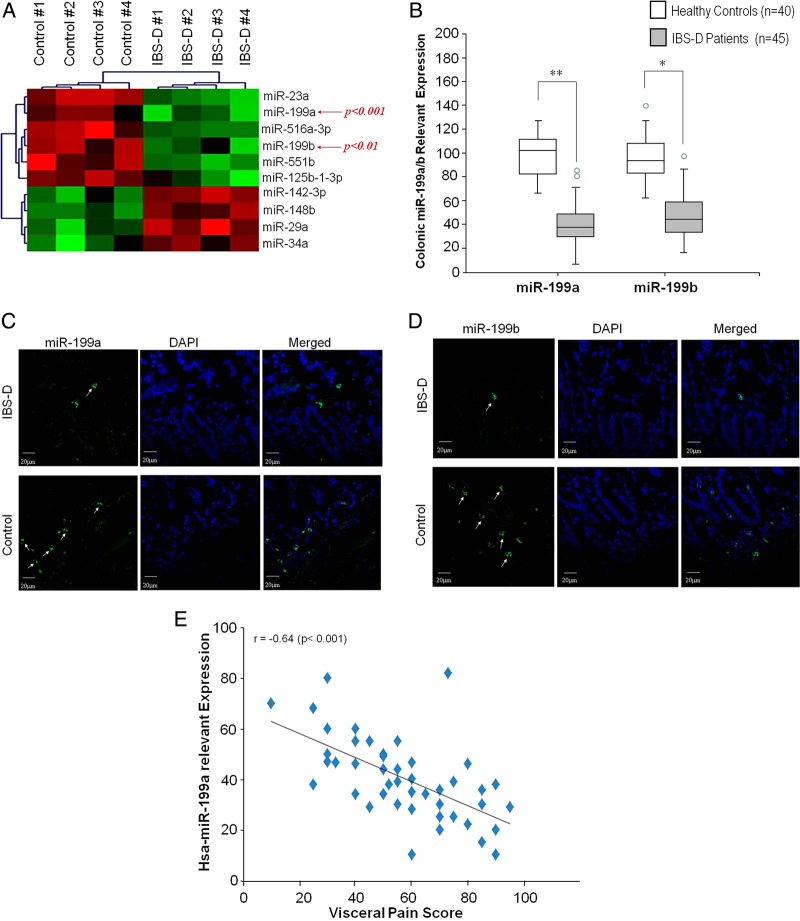
Figure 1.
Colonic miR-199a/b expression in patients with diarrhoea-predominant IBS (IBS-D). Microarray heat map depicting microRNA (miRNA) profiling of colonic biopsies from four patients with IBS-D and four controls. (A) Green colour illustrates decreased miRNAs expression, and red shows upregulation of miRNAs expression. Expression of miR-199a and miR-199b was significantly downregulated in patients with IBS-D compared with controls (p<0.001 and <0.01, respectively). (B) Box plots for the distribution of miR-199a and miR-199b. The bottom and top edges of the box indicate the intraquartile range, and the line inside the box indicates the mean. The circles outside the boxes are outliers (data points >1.5*IQR). Colonic miR-199a and miR-199b of IBS-D is decreased compared with controls (**p<0.01; *p<0.05). (C) Fluorescence in situ hybridisation (FISH) was used to identify the localisation of human colon tissue sections using a specific miR-199a probe. Substantial decreases in miR-199a expression in the colon of patients with IBS-D (upper panel) compared with controls are present (lower panel). (D) FISH on colon tissue sections using a labelled, specific miR-199b probe. Substantial decreases in miR-199b expression in the colon of patients with IBS-D (upper panel) compared with controls are present (lower panel). (E) Scatterplot of colonic miR-199a expression versus visceral pain scores in patients with IBS-D. The figure shows the regression line illustrating Spearman's correlation coefficients (r). DAPI, 4′,6-diamidino-2-phenylindole.

