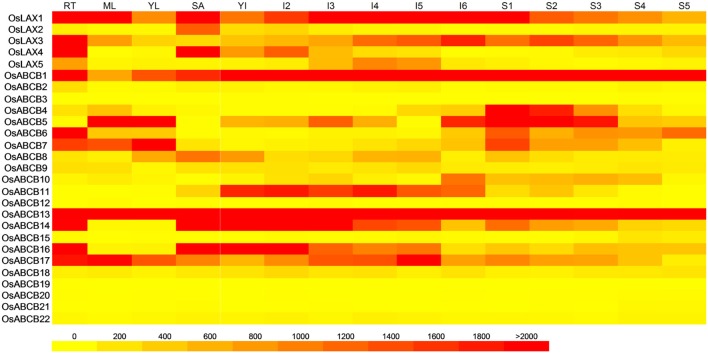
Figure 4.
Tissue/organ specific gene expression patterns of OsLAXs and OsABCBs. The heat map was constructed using publicly available microarray data of rice (Jain et al., 2007; Patel et al., 2012). RT, roots; ML, mature leaves; YL, young leaves; SA, shoot apical meristem; YI, young inflorescence; I2–I6, inflorescence from stage 2 to stage 6; S1–S5, developing seed from stage1 to stage5.

