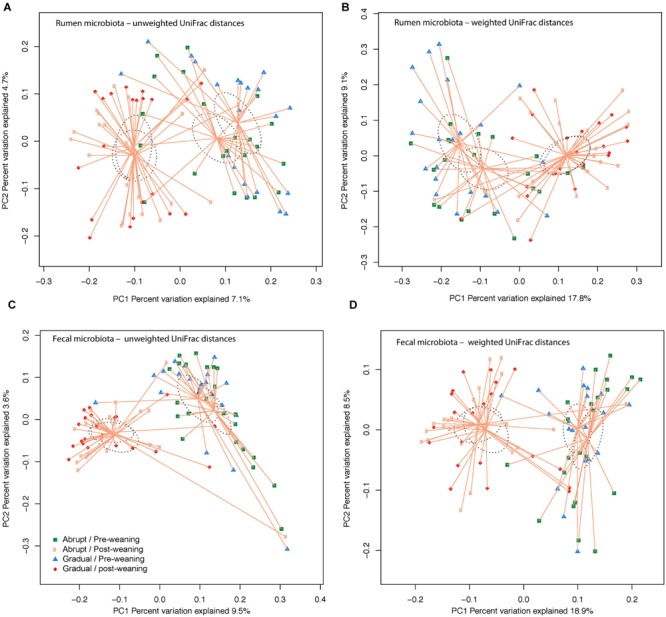
FIGURE 1.

Similarity of the bacterial communities between weaning strategy (abrupt vs. gradual weaning; P > 0.05) and weaning status (pre- vs. post-weaning; P < 0.001). Distance between the samples, based on similarity in OTU composition (OTU similarity ≥ 97%) calculated using (A) unweighted UniFrac distances in the rumen; (B) weighted UniFrac distance in the rumen; (C) unweighted UniFrac distance in feces; and (D) weighted UniFrac distance in feces, and were visualized in principal coordinates analysis (PCoA) plots. A greater distance between two points infers a lower similarity, whereas similar OTUs cluster together. The impact of weaning and weaning strategy on the clustering pattern of microbial communities were tested using PERMANOVA (implemented in PRIMER-6 software). P < 0.05 were considered significant.
