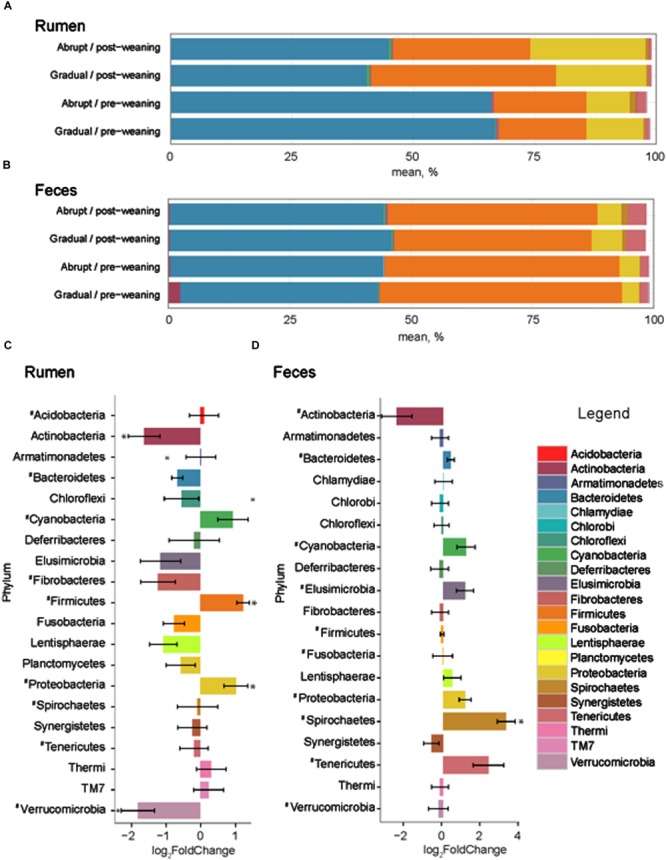
FIGURE 2.

Phylum level composition. Color-coded bar plots showing average bacterial phyla distribution (%) in (A) rumen and (B) feces of pre- and post-weaned calves for each weaning strategy. Average log2 fold change comparisons between pre- and post-weaned calves across both weaning strategies are also presented in the (C) rumen and (D) feces. ∗ Represents significant differences (P < 0.05) between pre- vs. post-weaned calves. # Represents taxa present at >0.1% of the community.
