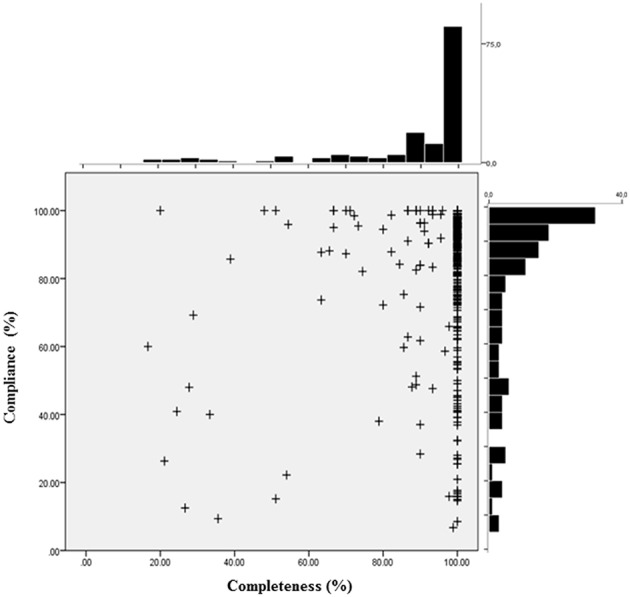
Figure 3.

Distribution of response compliance and treatment completeness. The scatterplot depicts for each patient (+) the individual compliance and completeness score. Compliance denotes the percentage of days a client answered the questionnaire per number of days of his/her actual hospital stay. Completeness is defined as the percentage of days a client fulfilled the planned treatment stay (50 or 90 days, respectively).
