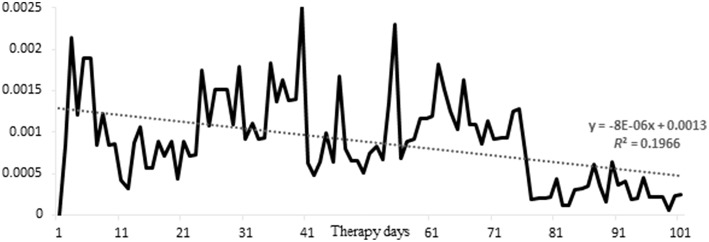
Figure 4.
Distribution of missed days. Depicted is per day the squared number of missed days, divided by the product of total possible number of clients missing a day X the total number of missed days in the sample; one can interpret the figure as the distribution of missed days, corrected for the fact that the sample thins out toward increasing number of therapy days.

