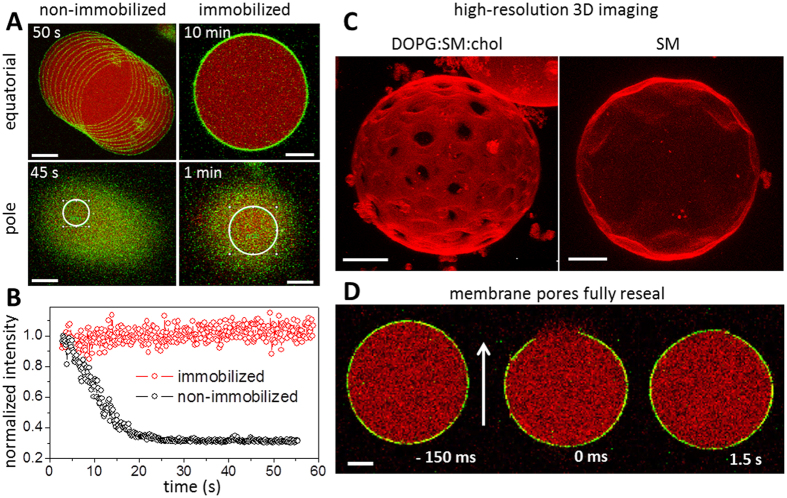
Figure 1. GUV immobilization efficiency.
(A) Overlay of consecutive snapshots of POPC GUVs in the absence (left) and presence (right) of 0.5% w/v agarose gel in the external medium. Upper and lower images show confocal images of the equatorial cross sections (top) and the vesicle surface at the poles (bottom), respectively. The total measurement time is shown in the top corner of each picture. The membrane is labeled with 0.5 mol% of NBD-PE (false green color) and the vesicles encapsulate 2.5 μM SRB (false red color). (B) Fluorescence intensity of NBD-PE measured inside the ROIs indicated in A (white circle – proportional to the GUV size) as a function of time. (C) High-resolution 3D image reconstructions of GUVs immobilized in 0.5% w/v agarose. Left: GUV composed of DOPG:SM:chol (3:5:2–molar ratio) with 0.1 mol% of DiI C18. Ld and Lo domains are visible as bright and dark regions in the GUV membrane, respectively. Cross-sections (262 in total) were acquired at 512×512 pixels and 400 Hz scanning speed. Right: GUV made of made SM (in the gel phase) with 0.1 mol% DiI C18. Cross-sections (100) were acquired at 512×512 pixels and 400 Hz scanning speed. (D) Confocal snapshots of a GUV labeled with 0.5 mol% NBD-PE (green) dispersed in 0.5% w/v agarose and encapsulating 2.5 μM SRB (red). The images show the vesicle before and after membrane poration induced by an applied DC pulse (3 kV/cm, 150 μs). The pore region corresponds to the membrane discontinuity segment. Numbers correspond to time relative to the application of the pulse. The electric field direction is shown as an arrow. All scale bars correspond to 10 μm.

