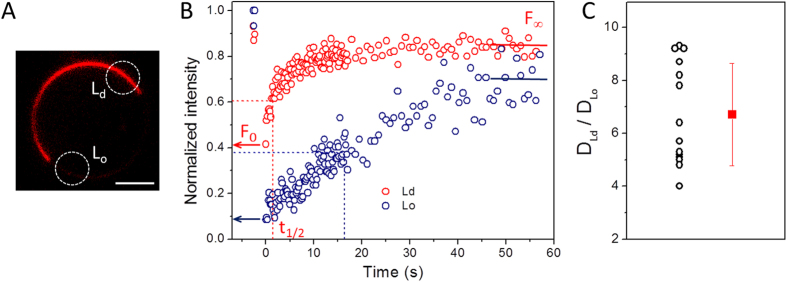
Figure 4. GUV immobilization allows quantification of lipid lateral mobility in phase separated membranes.
(A) Confocal cross section of a DOPG:SM:chol (3:5:2–molar ratio) GUV immobilized in 0.5% w/v agarose. The membrane is labeled with 0.1 mol% of DiI C18. Ld and Lo domains are visible as bright and weakly fluorescent regions in the GUV membrane, respectively. Scale bar: 10 μm. (B) FRAP recovery data for Ld (red) and Lo (blue) domains performed on the ROIs (marked with dashed white circles in (A). F0, t1/2 and F∞ are the initial fluorescence after photobleaching, the half-time of recovery and the fluorescence after recovery, respectively. (C) Ratio of half-time of recovery t1/2 for the Lo and Ld domains obtained on the same vesicle. Each point represents a single GUV.

