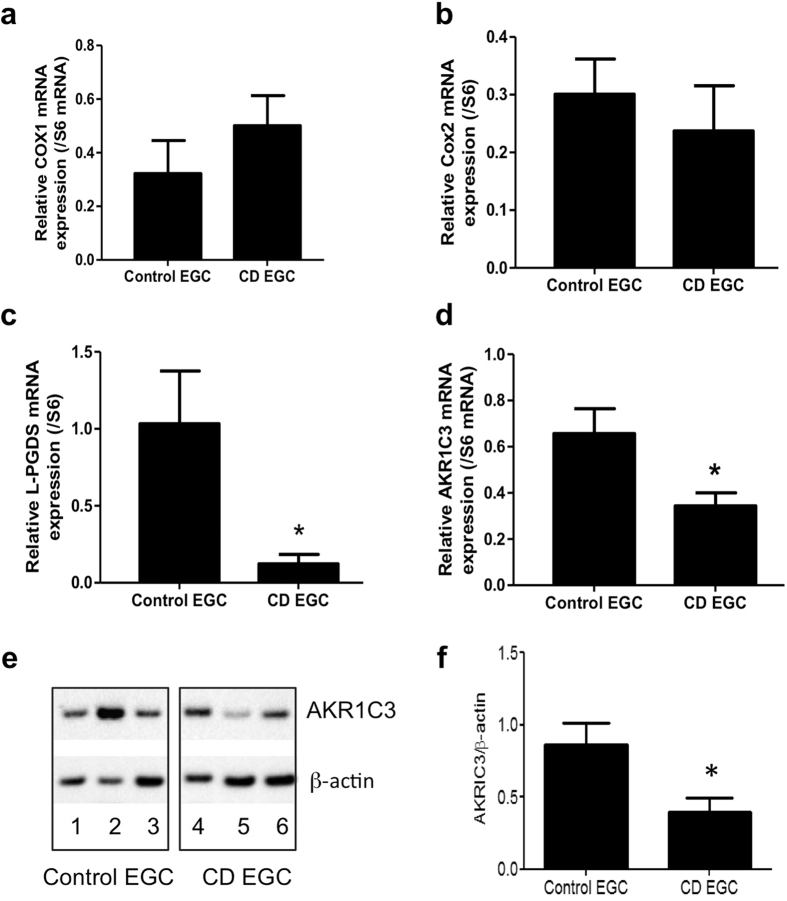
Figure 4. CD EGC present a defect in L-PGDS and AKR1C3 expressions.
Quantitative PCR analyze of Cox1, Cox2, L-PGDS and AKR1C3 mRNA expression related to S6 mRNA expression. Control and CD EGC expressed the same level of Cox1 and Cox2 (a and b) mRNA expression but CD EGC had a significantly reduced expression of L-PGDS (c) and AKR1C3 (d); n = 1–13 control EGC and n = 11–12 CD EGC. (e) Representative western blotting analyzes of AKR1C3 expression in Control EGC (patient 1, 2, 3) and CD-EGC (patients 4, 5, 6). (f) Quantification of AKR1C3/β-actin from n = 11 control EGC and n = 8 CD EGC. Data represent mean ± SEM,; Mann-Whitney test; *p < 0.05 as compared to control EGC.

