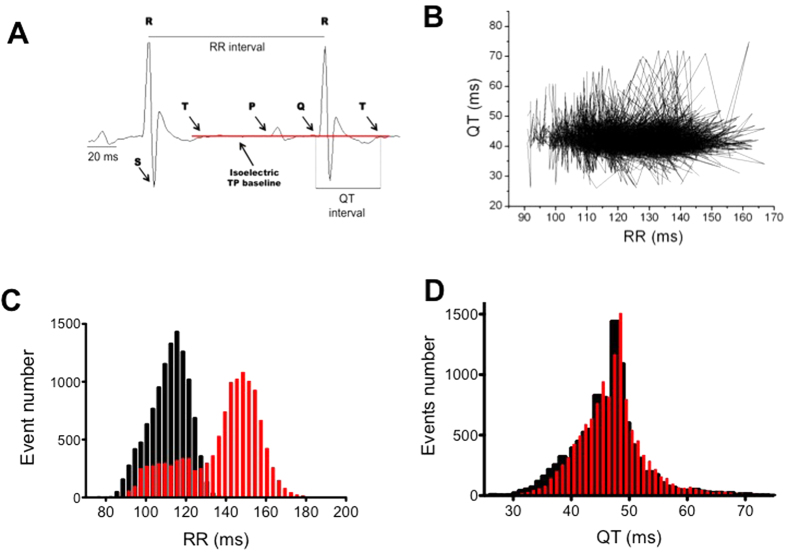
Figure 1. QT-RR relationship of a typical mouse.
(A) Typical example of an ECG recording and ECG-wave placements. (B) QT-RR relationship recorded for 30 min during the nocturnal period. Pairs are linked by straight lines to emphasize the density of points in the middle of the cloud. (C) example of a frequency histogram of distribution of the RR interval during the nocturnal (black) and diurnal periods (red) measured during 30 min in the middle of each period. (D) QT frequency histogram of distribution from the same mouse than in B.

