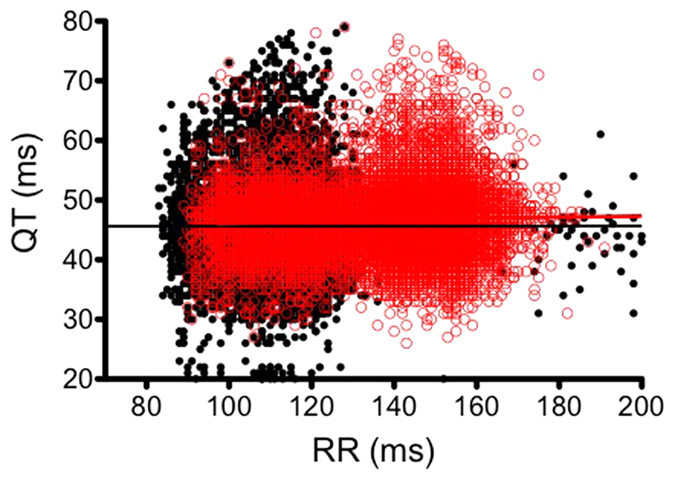
Figure 3. QT-RR relationship recorded over 30min during the nocturnal (black) and the diurnal (red) periods (see Method section).

Straight lines indicate the linear regression line calculated during both periods.

Straight lines indicate the linear regression line calculated during both periods.