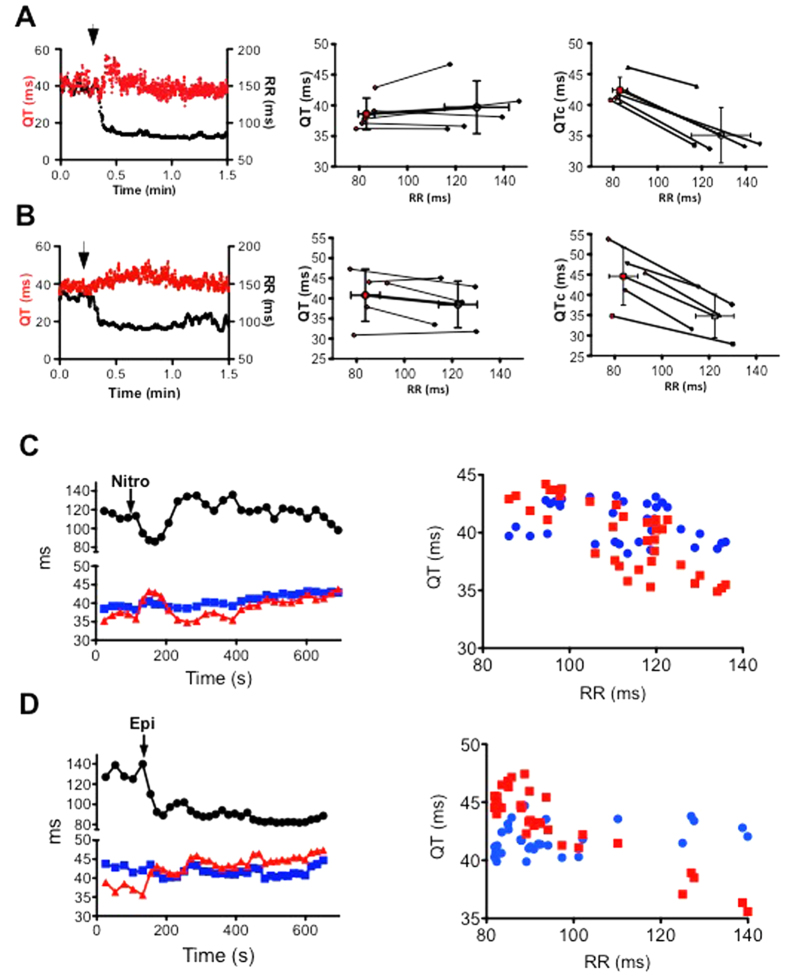
Figure 5.
Influence of abrupt changes in cardiac frequency on QT interval and RR intervals in 5 mice before (black) and after (red points) IP injection of norepinephrine (A) or nitroprusside (B). Open circles give the mean RR and QT ± SD and filled circles the individual measurements. Left, typical evolution of QT (red) and RR (black) intervals just before and in the minute following the injection; middle, raw QT-RR relationship; right, QTc-RR relationship. Evolution of the QT and QTc intervals according to the RR intervals over-time. QT (blue points), QTc (red points) and RR intervals (black points) were measured 5 minutes before and 15 minutes after injection of nitroprusside (C) or Epinephrine (D). QTc were calculated according to Mitchell’s formula.

