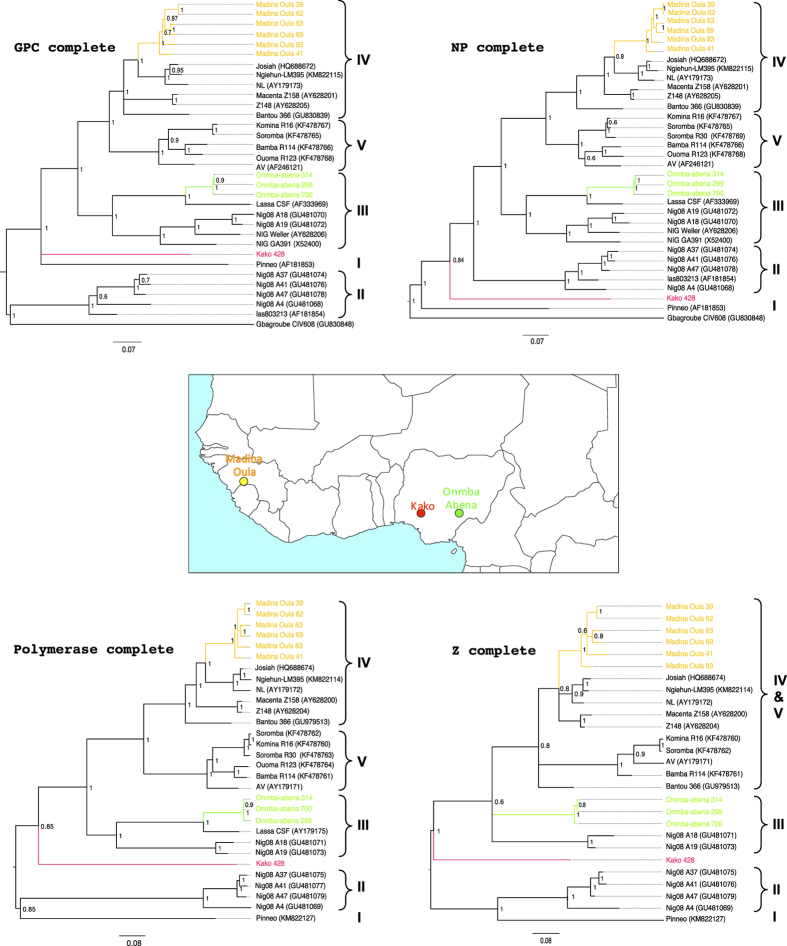
Figure 1. Bayesian phylogenetic analyses based on nucleotide sequences of the complete GP, NP, L and Z segments of LASVs showing the placement of the virus strains isolated in this study in comparison to other sequences representing the members of LASV lineages I–V.
Inset is a map of West Africa showing various sites sampled. Different colours (red, green and yellow) of sequences in the phylogenies indicate the geographical origin (in the map) from which the sequences were obtained during this study. Statistical support of grouping from Bayesian posterior probabilities (clade credibilities ≥70%) is indicated at the nodes. Strain names, GenBank accession numbers are indicated on the branches. Scale bar indicates mean number of nucleotide substitutions per site. The map of West Africa was downloaded from http://d-maps.com/carte.php?num_car=752&lang=fr, and then modified using the software EazyDraw v 5.3.0 (http://eazydraw.com).

