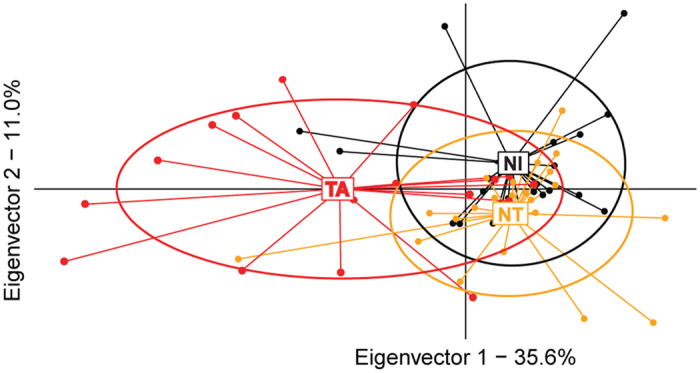
Figure 3. Quantitative analyses of brood ester pheromone (BEP) profiles.

Discriminant analysis of VSH-targeted (TA, red), non-targeted (NT, orange) and non-infested (NI, black) cells, based on the 9 BEP compounds that were detected in the samples (18 ≤ n ≤ 24 per group). Ellipses cover 67% of the samples of each group.
