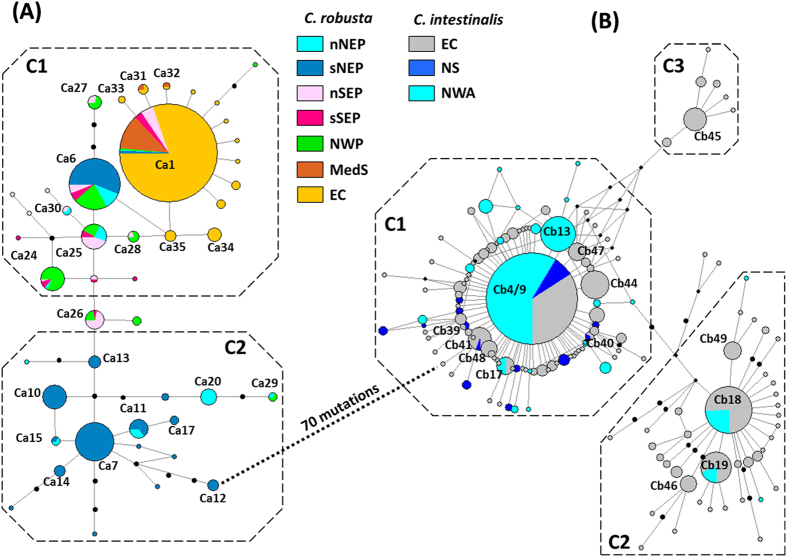
Figure 3.
Median-joining haplotype networks of Ciona robusta (A) and C. intestinalis (B) based on COX3-ND1 sequences. Data from this study and from Zhan et al.25. Haplotype circles are proportional to haplotype frequency in the whole dataset. Branch lengths are proportional to number of mutational steps between two haplotypes. Missing haplotypes are indicated by small black circles. Colors represent the regions where the individuals possessing the haplotypes were found (regional codes are provided in Table 1).

