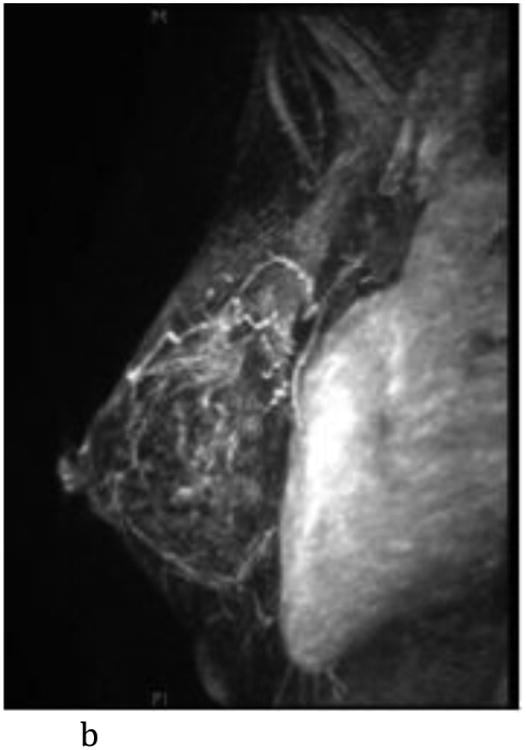
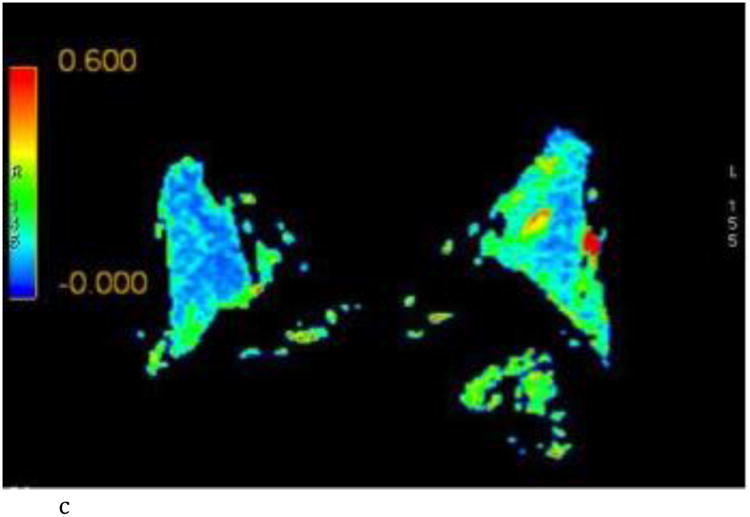
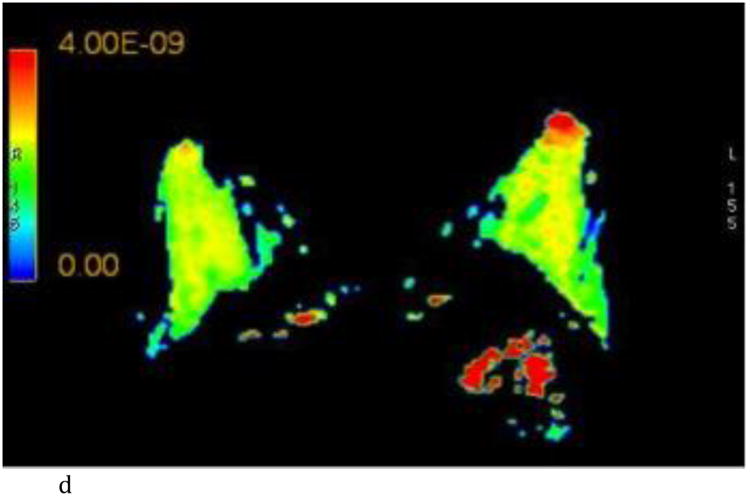
Figure 2.
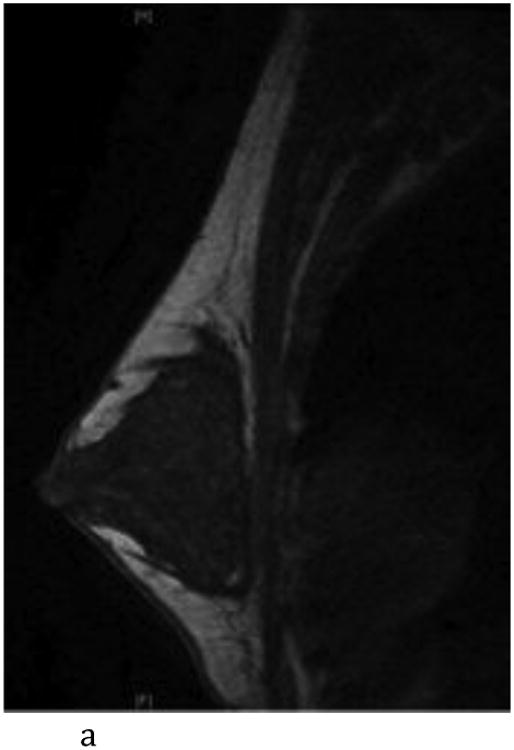
- Sagittal T1-weighted non-fat-suppressed MR image shows an extremely glandular normal left breast.
- Sagittal T1-weighted fat-suppressed post contrast maximum intensity projection MR imaging shows a normal left breast with marked background parenchymal enhancement.
- Axial FA color map.
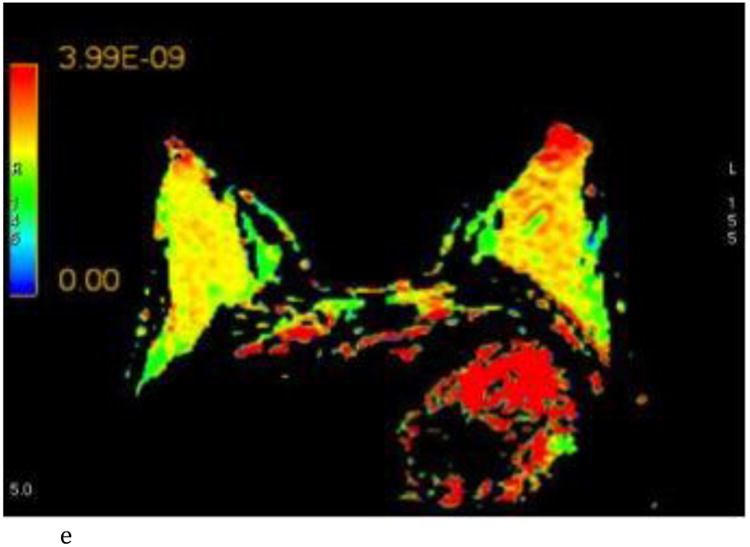
- Axial ADC color map, color scale in m2/s.
- Axial λ1 color map, color scale in m2/s.
