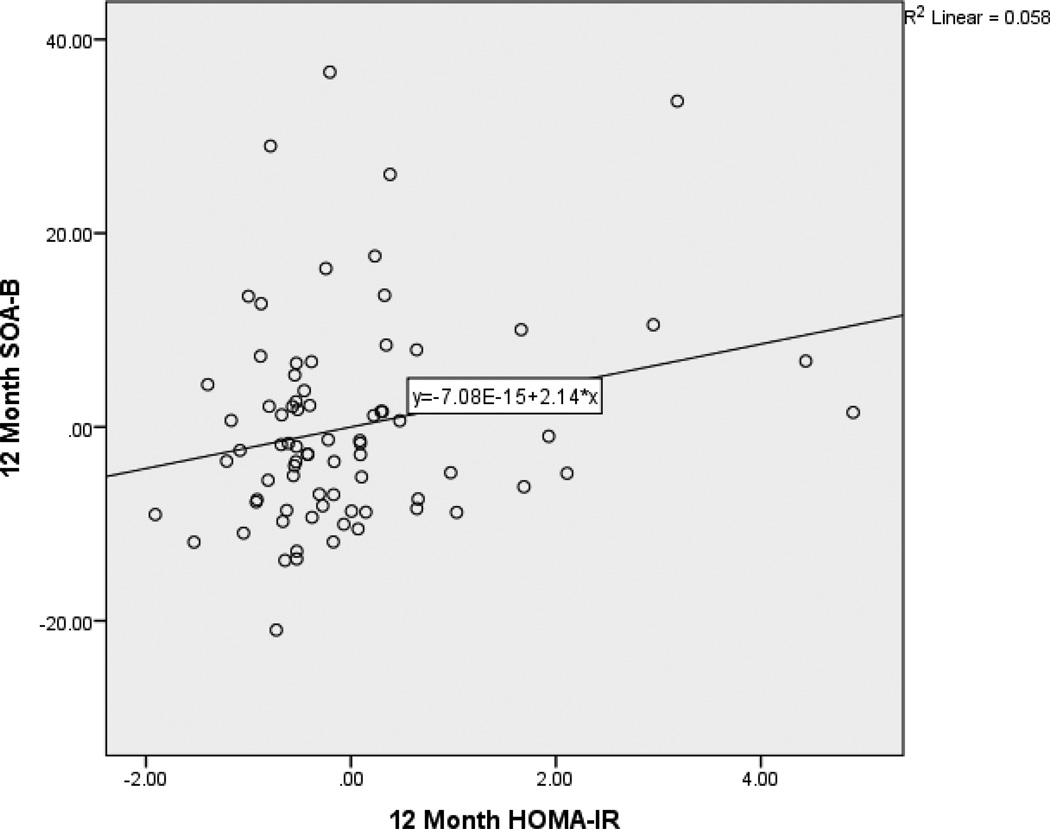
Figure 3.
Partial Regression Plot of the Relationship between 12-Month HOMA-IR and switching of attention – letters and numbers. This plot depicts the nature of the relationship between 12-month HOMA-IR and 12-month switching of attention - letters after accounting for baseline values of these variables and age. Lower performance on switching of attention - letters and numbers is better.

