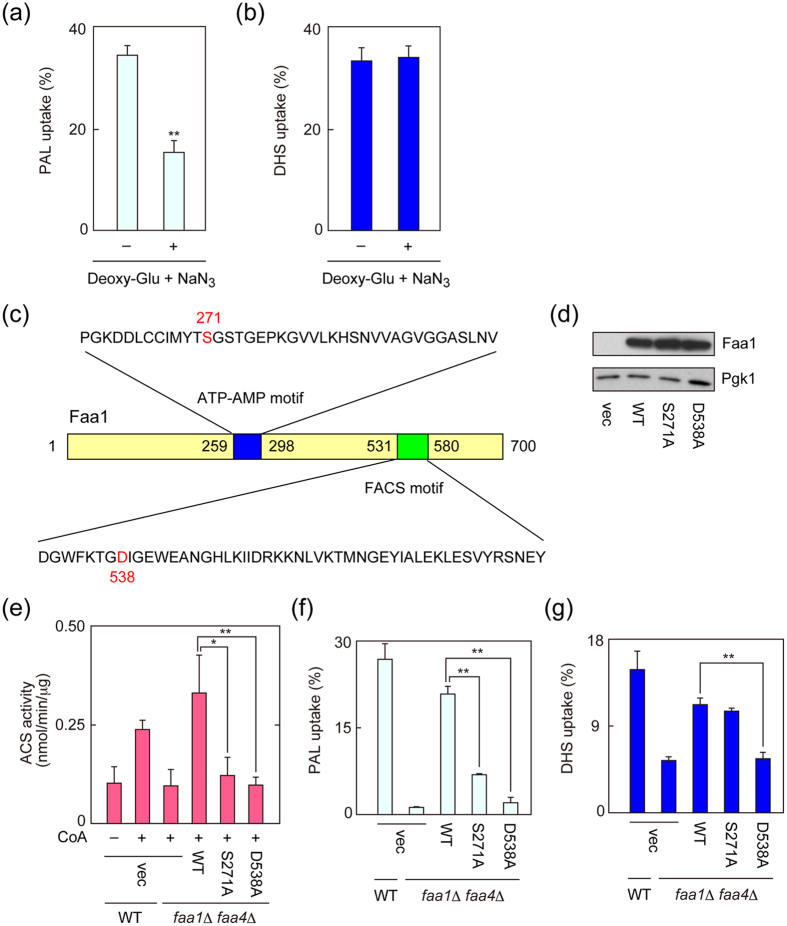
Figure 4. ATP-dependency is different between LCB and LCFA uptakes.
(a,b) BY4741 (wild-type; WT) cells were incubated with 50 mM 2-deoxy-D-glucose (Deoxy-Glu) and 3 mM sodium azide (NaN3) at 30 °C for 10 min and then labeled with 20 μM [3H]palmitic acid (PAL) for 30 min (a) or 20 μM [3H]DHS for 5 min (b). Radioactivities associated with cells, medium, and glass test tubes were counted by a liquid scintillation counter, and those associated with cells are expressed as a percentage of the total radioactivity. Values represent the means ± SDs of three independent experiments, and statistically significant differences are indicated (t-test; **p < 0.01). (c) Structure of the Faa1 protein and the location and sequences of the ATP-AMP and FACS motifs are represented. The amino acid residues mutated in this study are shown in red. (d,e) AOY13 (faa1Δ faa4Δ) cells harboring the pAKNF316 (vector; vec), pNRT15 (3xFLAG-FAA1), pNRT39 (3xFLAG-FAA1 S271A), or pNRT40 (3xFLAG-FAA1 D538A) plasmid were grown in SC-URA medium at 30 °C. (d) Total cell lysates were prepared from them, separated by SDS-PAGE, and detected by immunoblotting with anti-DYKDDDDK or, to demonstrate equal protein loading, anti-Pgk1 antibody. (e) Total cell lysates prepared from them were subjected to an in vitro ACS assay using 10 μM [3H]palmitic acid in the presence or absence of CoA. The assay was performed at 37 °C for 2 min. The reaction product [3H]palmitoyl-CoA was separated from unreacted [3H]palmitic acid by phase-separation, and its radioactivity was measured using a liquid scintillation counter. Values represent the means ± SDs of three independent experiments, and statistically significant differences are indicated (t-test; *p < 0.05; **p < 0.01). (f,g) BY4741 cells bearing the pAKNF316 plasmid and AOY13 cells bearing the pAKNF316, pNRT15, pNRT39, or pNRT40 plasmid were labeled with 20 μM [3H]palmitic acid at 30 °C for 30 min (f) or with 20 μM [3H]DHS at 30 °C for 5 min (g). Transport activity was determined as in (a). Values represent the means ± SDs of three independent experiments, and statistically significant differences are indicated (t-test; **p < 0.01).

