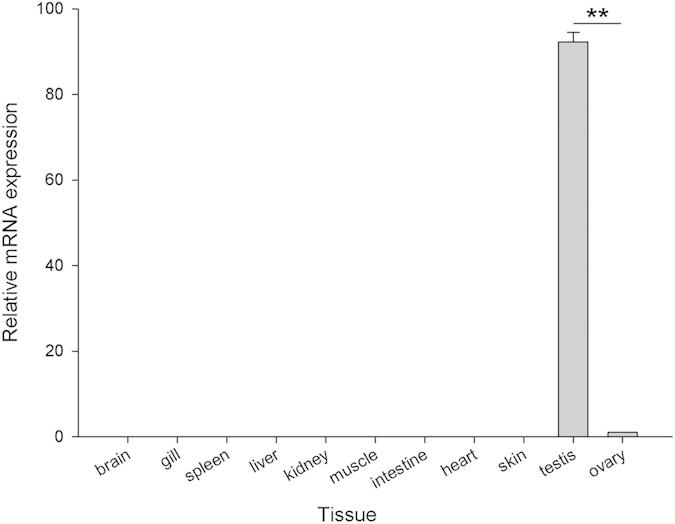
Figure 2. Tissue distribution of OsZFAND3 mRNA in 11 tissues from three female and three male hybrid tilapia individuals using qPCR.

Each bar indicates the mean + SE. ** Indicates that the difference is extremely significant.

Each bar indicates the mean + SE. ** Indicates that the difference is extremely significant.