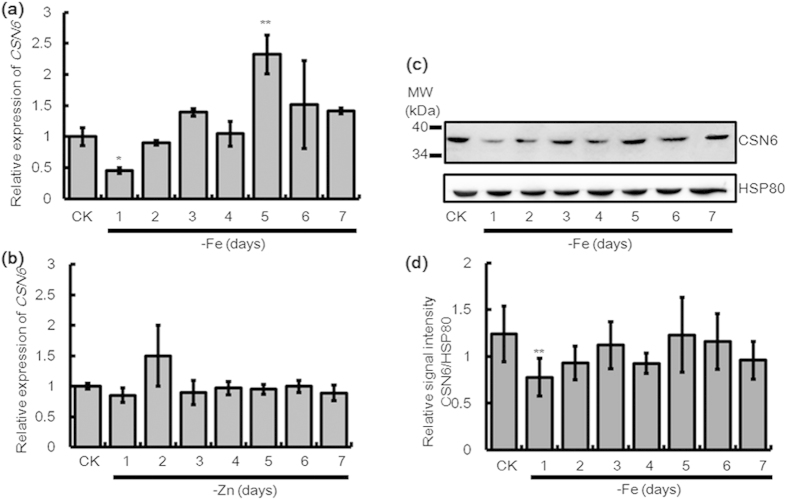
Figure 1. Relative expression change of CSN6 at the mRNA and protein levels during -Fe.
Change in the expression level of CSN6 following growth under 7 days of (a) -Fe and (b) -Zn in 14-day-old WT seedlings by qRT-PCR. Relative transcript levels are compared with those in WT seedlings cultured on +Fe or +Zn (shown “CK”). (c) Immunoblot analysis of CSN6 protein accumulation patterns following growth under 7 days of -Fe in 14-day-old WT seedlings using an anti-CSN6 antibody. Equal protein loading was confirmed by immunoblotting with an antibody against rice HSP80. (d) The histogram represents quantification of the CSN6 bands by Image J. CSN6 protein levels are expressed as a ratio of CSN6 to HSP80. Error bars indicate SD (n = 3). Asterisks indicate P < 0.05 (*) and P < 0.01 (**) in Student’s t test analysis.

