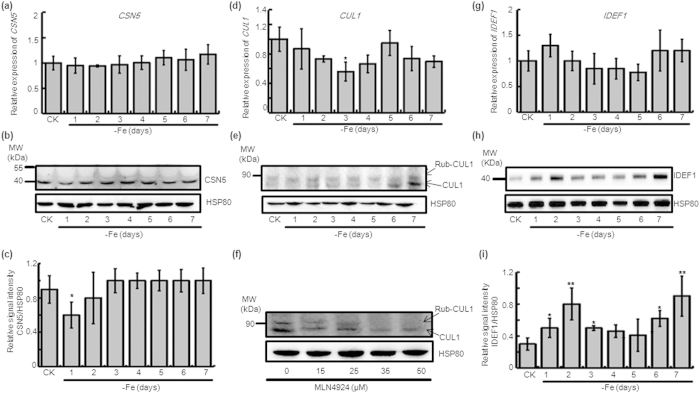
Figure 2. Relative expression levels of CSN5, CUL1, and IDEF1 in WT during iron-limited conditions.
Changes in the expression level of CSN5 following growth under 7 days of -Fe in 14-day-old WT seedlings by (a) qRT-PCR and (b) immunoblotting using an anti-AtCSN5 antibody, and (c) quantification of the CSN5 band using Image J. Changes in the expression level of CUL1 following growth 7 days of -Fe in 14-day-old WT seedlings by (d) qRT-PCR and (e) immunoblotting using an anti-CUL1 antibody. (f) Immunoblot with an anti-CUL1 antibody on protein extracts from 14-day-old rice seedlings treated with 7d MLN4924. Changes in the expression level of IDEF1 following growth under 7 days of -Fe in 14-day-old WT seedlings by (g) qRT-PCR and (h) immunoblotting using an anti-OsIDEF1 antibody, and (i) quantification of the IDEF1 band using Image J. Relative transcript levels were compared with those in WT seedlings cultured on +Fe (shown “CK”). Values shown are as the mean with SD (n = 3, *P < 0.05, **P < 0.01, Student’s t-test analysis). Protein levels are expressed as a ratio of CSN5 or IDEF1 to HSP80 and compared with the value for non-treated seedlings. Equal protein loading was confirmed by immunoblotting with an antibody against HSP80 in rice.

