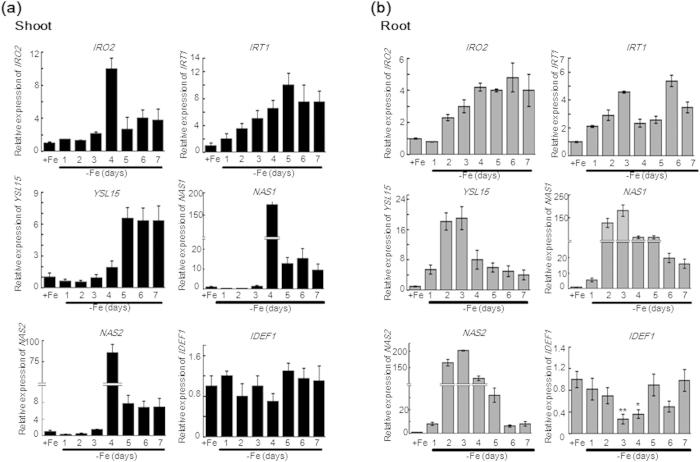
Figure 3. Quantitative analysis of typical iron utilisation-related genes during one to seven days of -Fe in WT plants.
A qRT-PCR assay showing the temporal expression patterns of IRO2, IRT1, YSL15, NAS1, NAS2, and IDEF1 in 14-day-old WT seedling shoots (a) and roots (b) after 7 days of -Fe. Relative transcript levels are compared with that in WT seedlings cultured on +Fe. Error bars indicate SD (n = 3). Asterisks indicate P < 0.05 (*) and P < 0.01 (**) in Student’s t test analysis.

