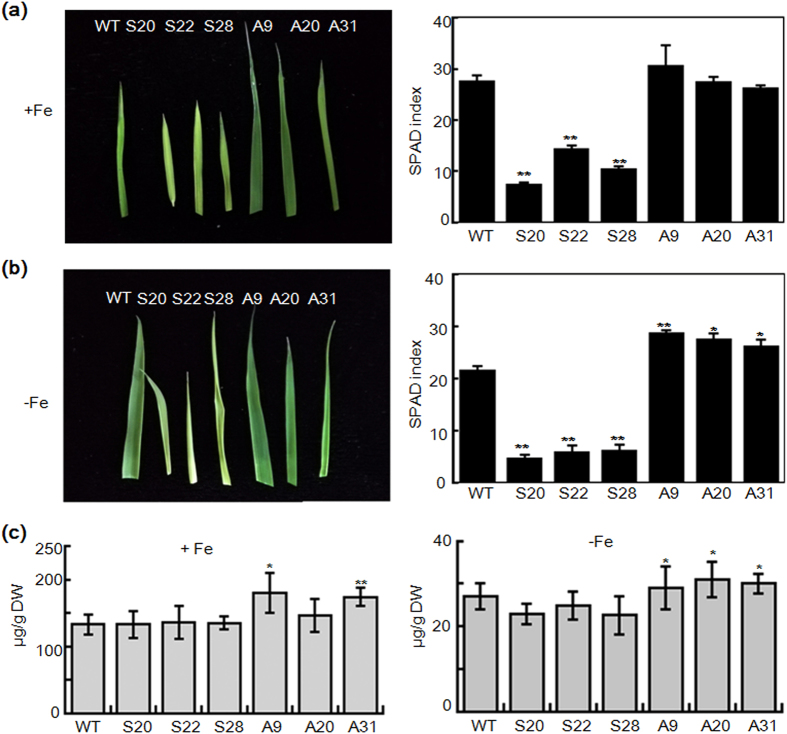
Figure 7. Soil and Plant Analyzer Development (SPAD) index in largest leaves and Fe concentration in seedlings of WT, antisense, and sense lines of 21-day-seedlings.
(a) Leaf phenotype (left) and chlorophyll content (right) of WT and transformants under normal conditions (+Fe, 100 μM Fe). (b) Leaf phenotype (left) and chlorophyll content (right) of WT and transformants under -Fe conditions (0 μM Fe). Bars represent means ± standard error of three independent plants (n = 3). Significant differences from WT were determined by Student’s t-test, P < 0.05 (*), P < 0.01 (**). (c) Fe concentration of WT and transgenic rice seedlings in iron sufficient (+Fe, 100 μM Fe) and deficient (0 μM Fe) conditions. S represents T3 seedlings of sense transgenic lines. A represents T3 antisense seedlings of transgenic lines. DW, dry weight. Bars represent the means ± standard errors of three independent analyses (n = 3). Significant differences from WT were determined by Student’s t test, P < 0.05 (*), P < 0.01 (**).

