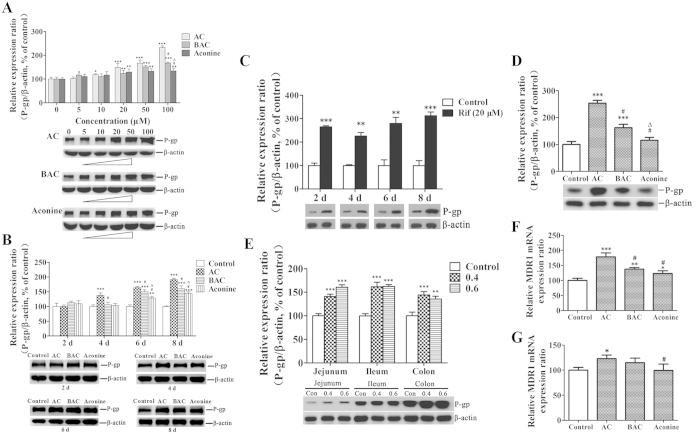
Figure 1. Effects of AC, BAC, and aconine on P-gp protein and mRNA levels.
P-gp protein levels were detected by Western blot analysis. mRNA levels were detected by real-time PCR analysis. (A) Dose-dependent effects on P-gp protein levels in LS174T total lysates after treatment with the tested drugs (5–100 μM) or the vehicle (control) for 6 days. (B) Time-dependent effects on P-gp protein levels in LS174T total lysates after treatment with the tested drugs (50 μM) or the vehicle (control) for 2–8 days. (C) LS174T cells were treated with rifampicin (Rif, 20 μM) for 2–8 days as the positive control for P-gp induction. (D) P-gp protein levels in Caco-2 cells after treatment with the tested drugs (50 μM) or the vehicle (control) for 6 days. (E) P-gp protein levels in FVB mice after treatment with AC (0.4/0.6 mg/kg) or the vehicle (control) for 14 days. MDR1 mRNA levels in LS174T (F) and Caco-2 (G) cells after treatment with the tested drugs (50 μM) or the vehicle (control) for 6 days. Densitometry results were related to β-actin and presented as the percentage of controls. GAPDH was used as the housekeeping gene for cells. Data represent mean ± SD (n = 3). *p < 0.05, **p < 0.01, and ***p < 0.001 compared with the control group; #p < 0.05 compared with the AC group; Δp < 0.05 compared with the BAC group.

