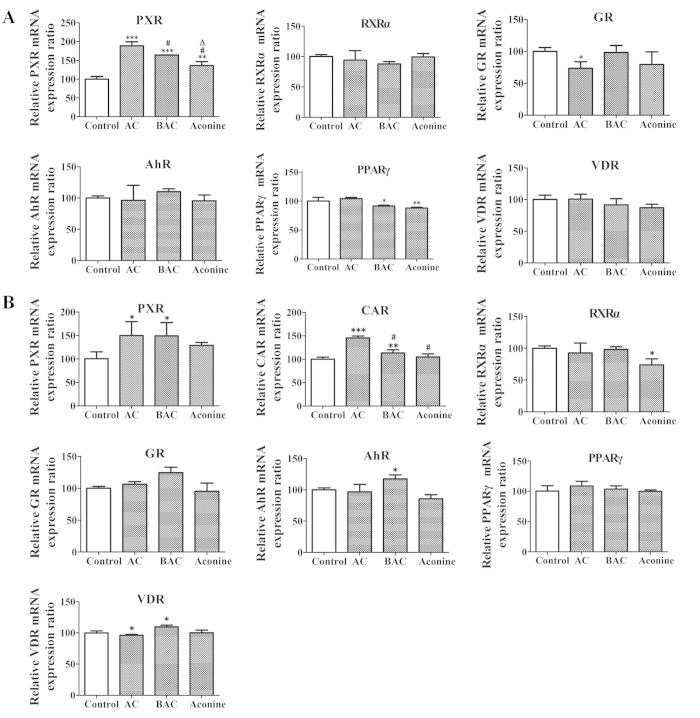
Figure 4. Effects of AC, BAC, and aconine on the mRNA levels of NRs.
Cells were treated with AC, BAC or aconine (50 μM) or vehicle (control) for 6 days. mRNA levels were detected by real-time PCR analysis. (A) Effects of AC, BAC, and aconine on PXR, PPARγ, GR, AhR, VDR and RXRα mRNA expression levels in LS174T cells. (B) Effects of AC, BAC, and aconine on PXR, CAR, PPARγ, GR, AhR, VDR and RXRα mRNA levels in Caco-2 cells. GAPDH was used as housekeeping genes for cells. Data represent mean ± SD (n = 3). *p < 0.05, **p < 0.01, and ***p < 0.001 compared with the control group; #p < 0.05 compared with the AC group; Δp < 0.05 compared with the BAC group.

