
Figure 1.
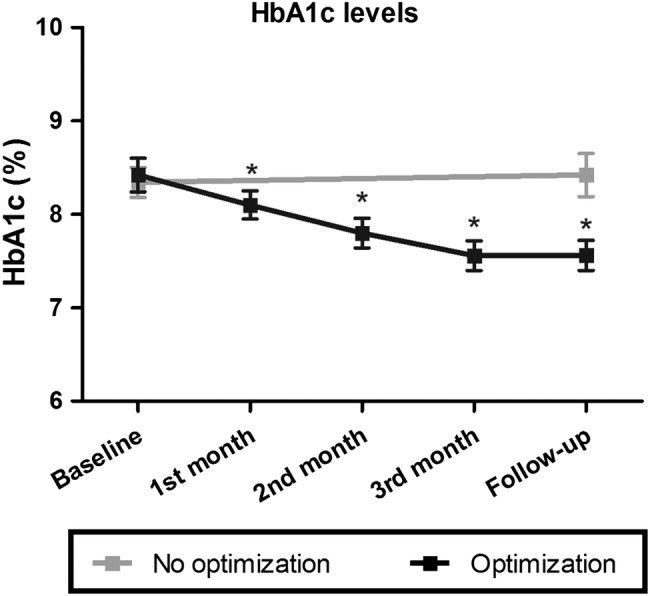
Hemoglobin A1c levels during the study (mean±SEM). The change from baseline to follow-up between groups differed significantly (p<0.001). *Indicates significant difference (p<0.05) as compared with baseline.
Official websites use .gov
A
.gov website belongs to an official
government organization in the United States.
Secure .gov websites use HTTPS
A lock (
) or https:// means you've safely
connected to the .gov website. Share sensitive
information only on official, secure websites.
Hemoglobin A1c levels during the study (mean±SEM). The change from baseline to follow-up between groups differed significantly (p<0.001). *Indicates significant difference (p<0.05) as compared with baseline.