Figure 3.
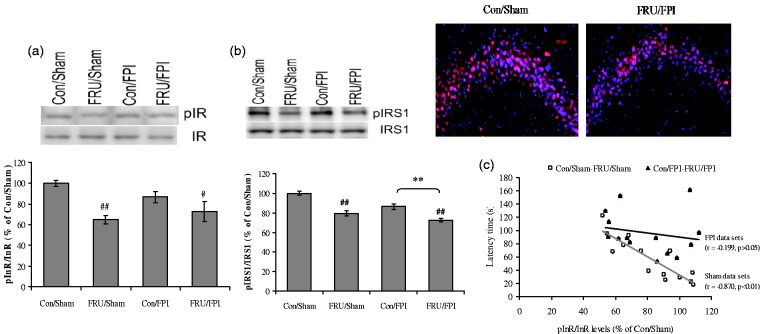
Influence of fructose and TBI on insulin signaling in the brain. Phosphorylation of (a) insulin receptor (InR), (b) IRS-1, representative immunofluorescent staining of pIRS1 (red) with DAPI nuclear stain (blue) (b, right), and (c) correlation analysis of InR phosphorylation with latency time in Barnes maze test in sham datasets (con/sham and FRU/sham) and FPI datasets (con/FPI and FRU/FPI). Intensity of immunofluorescent pIRS1 was reduced in the hippocampal CA3 region of FRU/FPI compared with con/sham (b, right). Data are expressed as percentage of con/sham (mean ± SEM). #P < 0.05, ##P < 0.01 versus con/sham; **P < 0.01 versus con/FPI; ANOVA (two-way) with Bonferroni’s comparisons post hoc test.

