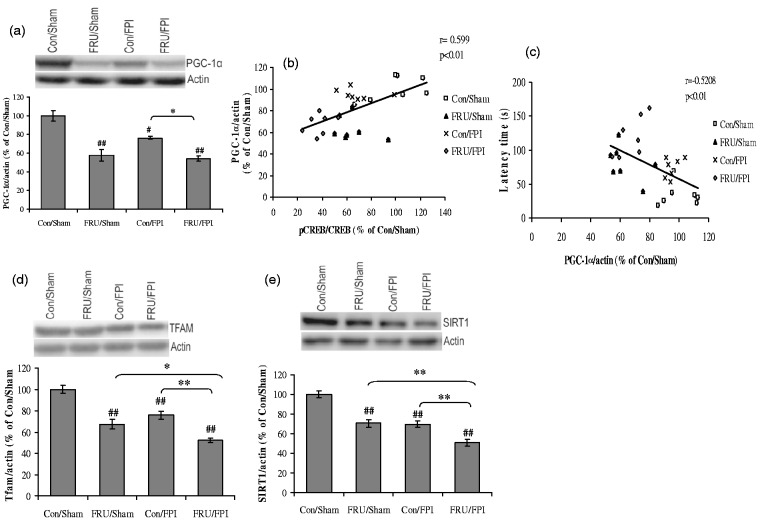
Figure 5.
Fructose and TBI affects cell energy regulators. (a) Levels of PGC-1α, (b, c) correlation analysis of PGC-1α with CREB phosphorylation and latency time in Barnes maze test, (d) TFAM, and (e) SIRT1 in regular (con) or fructose (FRU) drinking rats, subjected to either sham or fluid percussion injury (FPI). Data are expressed as percentage of con/sham (mean ± SEM). #P < 0.05, ##P < 0.01 versus con/sham; **P < 0.01 versus con/FPI; ANOVA (two-way) with Bonferroni’s comparisons post hoc test.

