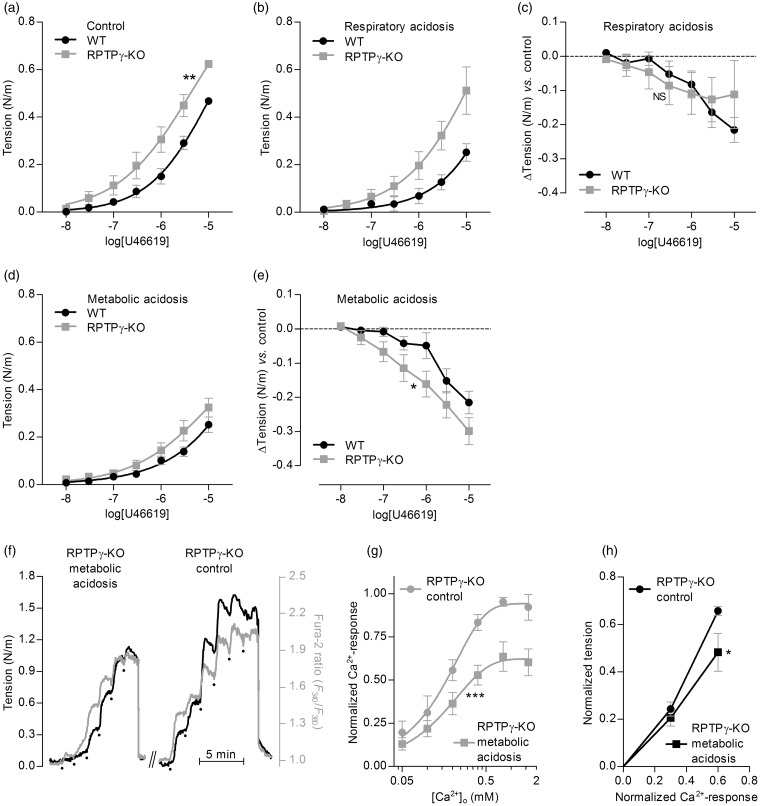
Figure 6.
Under equilibrated conditions, RPTPγ is required for sensing—such that basilar arteries from RPTPγ-knockout mice are hypercontractile—and vasorelaxation in response to metabolic acidosis is explained by a combination of attenuated Ca2+ uptake and reduced Ca2+-sensitivity. (a–e) Comparison of U46619-induced contractile responses of basilar arteries from RPTPγ-knockout (KO, n=8) vs. wild-type (WT, n = 10) mice. Panel (a) summarizes experiments under control conditions (pHo=7.4, []o=22 mM, CO2=5%); panel (b), under respiratory acidosis (pHo=7.1, []o=22 mM, CO2=10%); and panel (d), under metabolic acidosis (pHo=7.1, []o=11 mM, CO2=5%). Panels (c) and (e) summarize the average differences in U46619-induced contractile responses in basilar arteries from RPTPγ-knockout and wild-type mice during respiratory (panel c) and metabolic (panel e) acidosis compared to control conditions. (f) Representative time courses of arterial tension development and VSMC Ca2+-dependent fluorescence signal in Ca2+-depleted basilar arteries from RPTPγ-knockout mice in response to step-increases of [Ca2+]o during constant exposure to 10 µM U46619. We perform experiments under control conditions (pHo=7.4, []o=22 mM, CO2=5%) and during metabolic acidosis (pHo=7.1, []o=11 mM, CO2=5%). The dots indicate step-wise increments in [Ca2+]o from 0 to 0.05, 0.1, 0.2, 0.4, 0.8 and 1.6 mM. (g) Average -responses from experiments (n = 5) like that in panel (f). (h) Average tension development of basilar arteries from RPTPγ-knockout mice (n = 5) as a function of the VSMC -response under control (Continued) Figure 6. Continue. conditions (pHo=7.4, []o=22 mM, CO2=5%) and during metabolic acidosis (pHo=7.1, []o=11 mM, CO2=5%). The curves in panels (a), (b), (d) and (g) are the results of least-squares fits to sigmoidal functions; in panels (a) and (g), we compare them using extra sum-of-squares F-tests. The data points in panels (c), (e) and (h) are compared by repeated-measures two-way ANOVA; in panel (h), we report the significance level based on Bonferroni post-tests. *P < 0.05, **P < 0.01, ***P < 0.001, NS: not significantly different vs. wild-type (panels (a), (c) and (e)) or control conditions (panels (g) and (h)).

