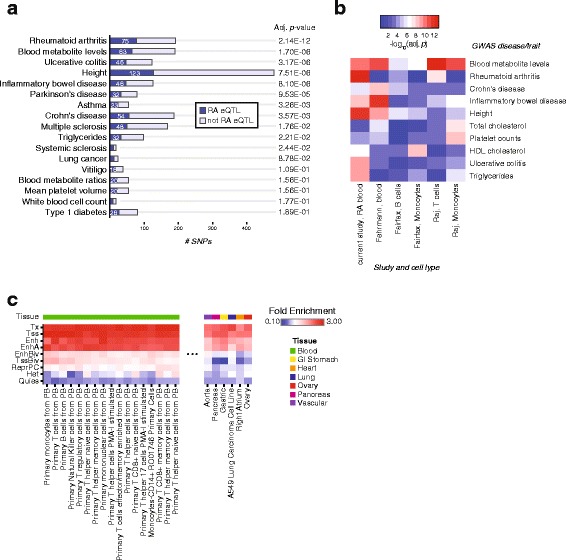
Fig. 2.

Comparison of RA eQTLs to published GWAS catalog and fold-enrichment of RA eQTLs in chromatin states from diverse tissues. a Comparison of RA cis-eQTLs to reported GWAS SNPs in the NHGRI catalog. The top 17 diseases or traits are shown, ranked by enrichment p value from one-sided Fisher’s exact test. The number of GWAS reported SNPs overlapping with RA eQTLs in our dataset are shown for each disease or trait. b Comparison of enrichment of GWAS SNPs in several eQTL studies. The top ten GWAS diseases or traits are shown. The eQTL studies are labeled by their first author and cell type or tissue where gene expression was measured. Only cis-eQTLs were considered. c Enrichment of RA eQTLs in chromatin states. Both cis- and trans-eQTLs were compared to positions of the following chromatin states in diverse tissues: transcription start sites (TSS), actively transcribed (Tx), enhancers (Enh), active enhancers (EnhA), heterochromatin (Het), bivalent enhancers (EnhBiv), bivalent/poised TSS (TssBiv), repressed Polycomb (ReprPC), and quiescent/low (Quies) regions. Only a subset of the cell or tissue types with the highest or lowest fold-enrichment in enhancer states are shown to ease representation. The full results are shown in Additional file 5: Figure S2
