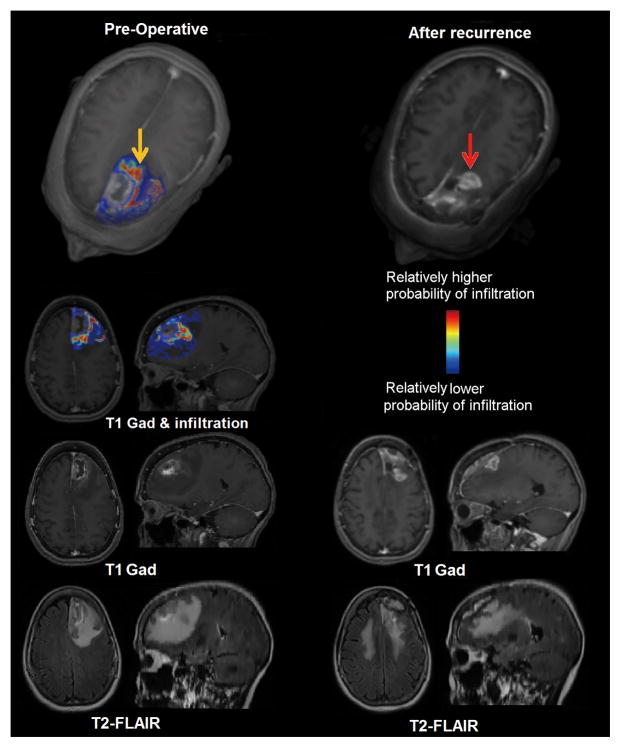
Figure 2. Replication study results.
Left panel presents an estimated map for tumor infiltration from preoperative MRI analysis; yellow arrow points to a region estimated to be relatively more infiltrated. Right panel represents the corresponding MR images after tumor resection and subsequent recurrence (red arrow) for the same patient. Recurrence occurred in the vicinity of peritumoral tissue originally estimated to be highly infiltrated. The first row represents a three-dimensional rendering of the images. The second, third, and fourth rows show T1-weighted with contrast fused infiltration map, T1-weighted with contrast, and T2-FLAIR respectively.

