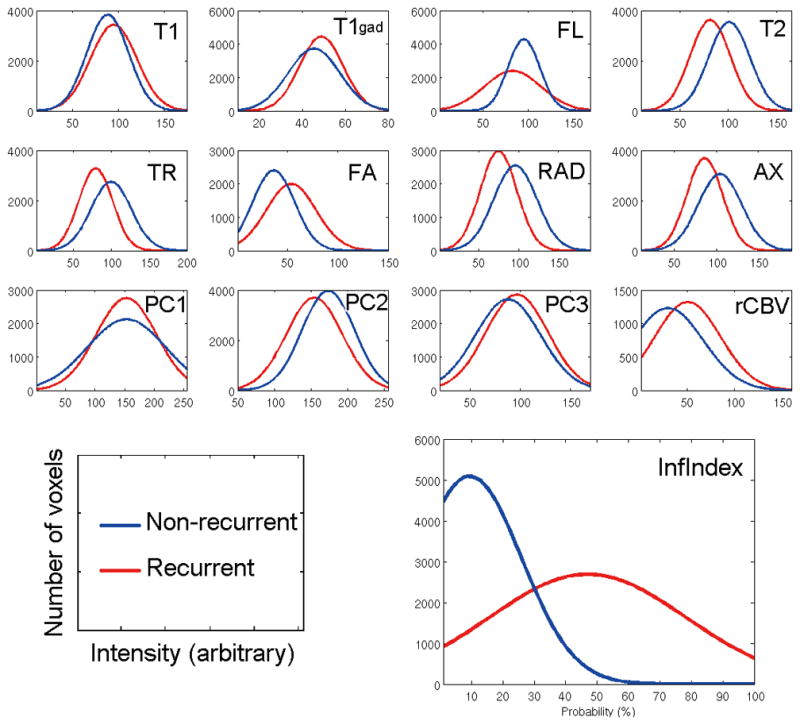
Figure 4. Imaging characteristics of recurrent and nonrecurrent tissue.

The figures demonstrate the imaging characteristics of the recurrence and nonrecurrence regions within the peritumoral edema on the preoperative MRI. Red represents the probability density function of the recurrence tissues, whereas blue represents the nonrecurrence tissues. T1, T1-weighted (AUC = 0.58); T1gad, T1-weighted contrast-enhanced (AUC,= 0.60); FL, T2–fluid-attenuated inversion recovery (AUC = 0.62); T2, T2-weighted (AUC = 0.76); TR, trace (AUC = 0.73); FA, fractional anisotropy (AUC = 0.73); RAD, radial diffusivity (AUC = 0.74); AX, axial diffusivity (AUC = 0.72); PC1, first principal component (AUC = 0.56); PC2, second principal component (AUC = 0.66); PC3, third principal component (AUC = 0.60); RCBV, relative cerebral blood volume (AUC = 0.72); Inf Index, infiltration index (AUC = 0.89). X-axis shows the intensity in arbitrary unit scaled between 0 and 255 and Y-axis is the number of voxels. The P value of a t-test showed a significant difference between the 2 groups in all modalities (P < .001).
