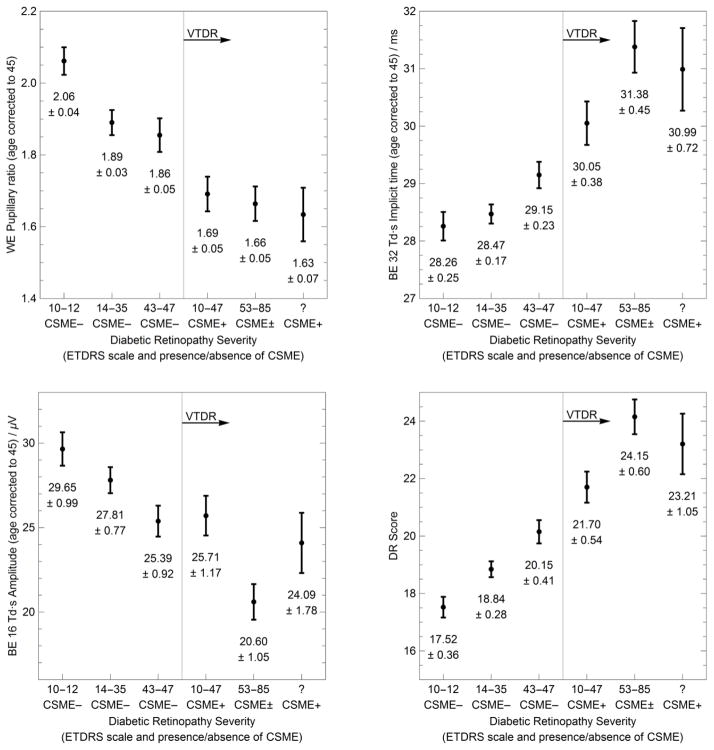
Figure 2.
Dependence of RETeval measurements on diabetic retinopathy severity level. Plots show the mean and standard error of the mean for three measurements and the overall RETeval measurement (DR Score) for each severity group. Severity group definitions and the number of subjects in each group can be found in Table 1. BE and WE stand for “best eye” and “worst eye” respectively.

