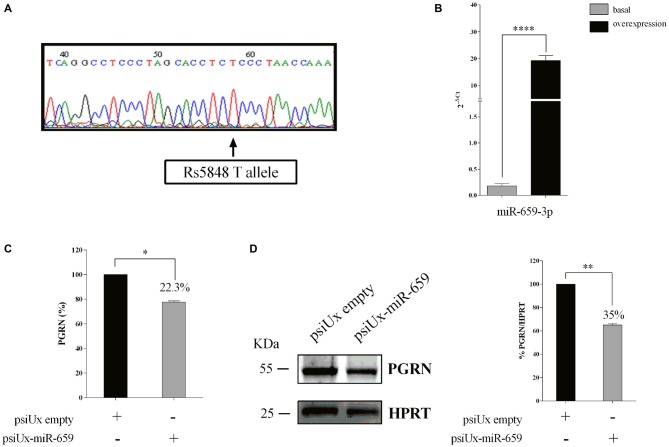
Figure 4.
Functional interaction between PGRN expression levels and miR-659-3p in Kelly cells. Kelly 3′UTR sequencing showing a TT genotype (A). Expression levels of miR-659-3p was measured by RT-qPCR after 48 h (B) from transfection. Mean ± SEM of two biological replicates and two technical replicates is shown (N = 4, ****p < 0.0001 vs. miRNAs basal expression levels). ELISA assay (B) for PGRN quantification in protein extracts from Kelly cells (N = 3; *p < 0.05). Western blot analysis (C) for PGRN detection in protein extracts from Kelly cells (N = 3; **p < 0.01). Western Blot image is representative of three biological replicates. Expression of Western Blot was normalized on HPRT expression (D).

