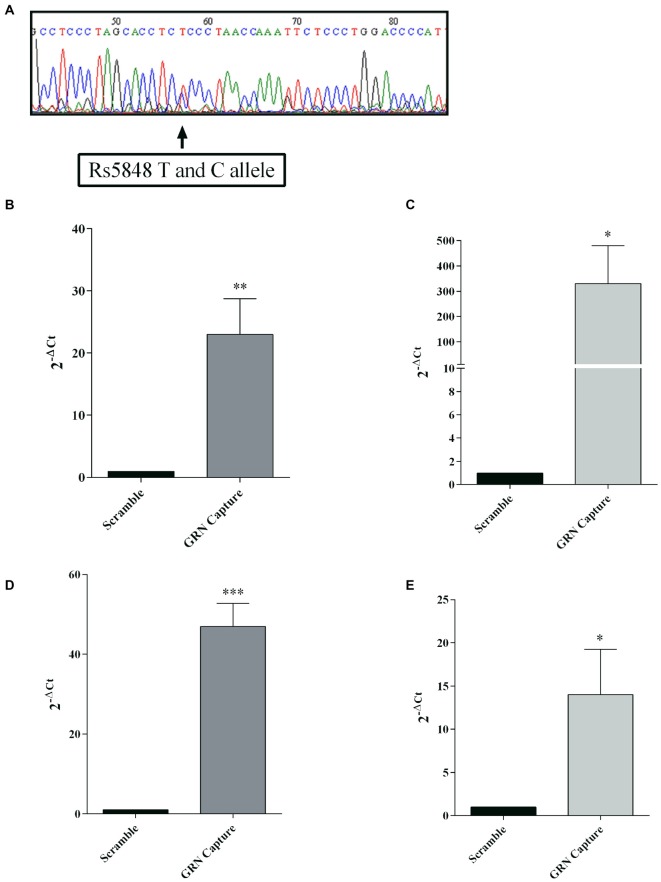
Figure 5.
mRNA:miRNA isolation technique for GRN mRNA from SK-N-BE cells. SK-N-BE 3′UTR sequencing showing a TC genotype (A). A capture anti-sense DNA oligonucleotide with a biotin modification at the 5′ end was designed to pull-down GRN mRNA. RT-qPCR showed enrichment of GRN mRNA and miR-659-3p in SK-N-BE (B,C, respectively) and Kelly samples (D,E, respectively) compared to a scramble oligonucleotide used as negative control. mRNA and miRNA expression was quantified using the 2−ΔCt method. Mean ± SEM of three biological replicates is shown (N = 9, *p < 0.05; **p < 0.01; ***p < 0.001 vs. scramble non specific control).

